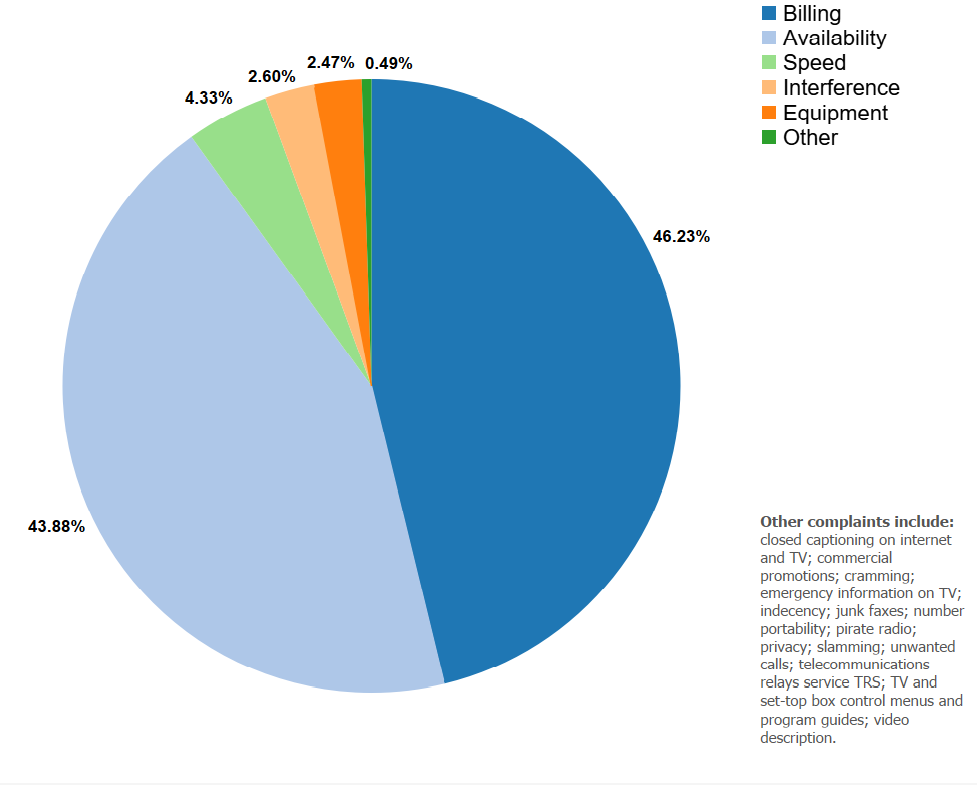
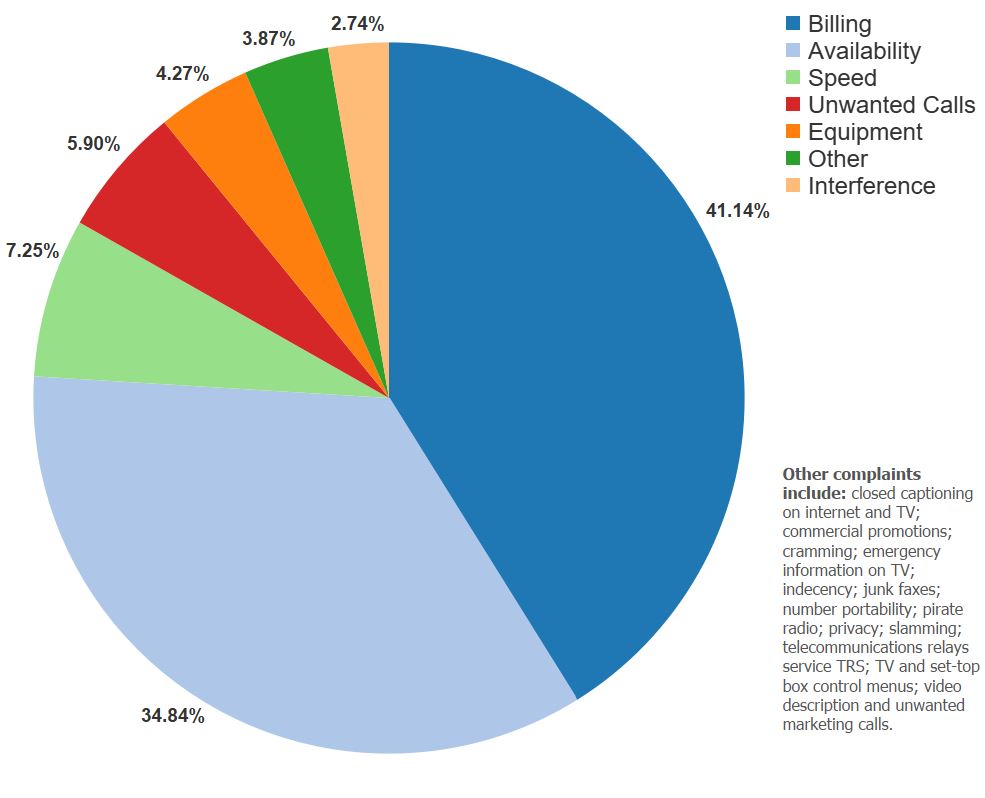
The charts below display the breakdown, by category, of informal consumer complaints related to COVID-19 and the Keep Americans Connected Pledge. The complaints were filed with the FCC between March 13, 2020 and May 31, 2021. The issues reflected in each chart were selected by consumers when submitting informal complaints to the FCC. These charts will be updated monthly during the course of the pandemic. The FCC does not verify all of the facts alleged in these complaints.

For more information about the FCC response to COVID-19 pandemic, visit our coronavirus page. For information about the pledge, visit our Keep Americans Connected page. To file a consumer complaint with the FCC, visit fcc.gov/complaints.
COVID Complaints

COVID Complaints Pie Chart: color key: dark blue – billing 41.51 percent; light blue – availability, 35.18 percent; light green – internet speed, 7.30 percent; red-unwanted calls, 5.76 percent; orange – equipment 4.31 percent; green – other, 3.19 percent; light orange– interference, 2.73 percent;

Download Source Data (xlsx file)


Keep Americans Connected Complaints

Keep Americans Connected Complaints: Pie Chart; color key and percentage: dark blue - billing; 46.23 percent; light blue - availability, 43.88 percent; light green - speed, 4.33 percent; pink - interference, 2.60 percent; orange - equipment, 2.47 percent; dark green - other, 0.49 percent


Download Source Data (xlsx file)


Updated:
Monday, June 14, 2021