Eleventh
Measuring Broadband America
Fixed Broadband Report
A Report on Consumer Fixed Broadband Performance
in the United States

Federal Communications Commission
Office of Engineering and Technology
Table of Contents
- Executive Summary
- Summary of Key Findings

- Methodology
- Test Results
- Additional test results
- Annex: MBA Performance During COVID-19 Pandemic
- Chart 1.1: Weighted average advertised download speed among the top 80% service tiers offered by each ISP
- Chart 1.2: Weighted average advertised download speed among the DSL ISPs
- Chart 2: Weighted average advertised download speed among the top 80% service tiers based on technology
- Chart 3: Consumer migration to higher advertised download speeds
- Chart 4: The ratio of weighted median speed (download and upload) to advertised speed for each ISP
- Chart 5: The percentage of consumers whose median download speed was greater than 95%, between 80% and 95%, or less than 80% of the advertised download speed
- Chart 6: The ratio of 80/80 consistent median download speed to advertised download speed.
- Chart 7: Latency by ISP
- Chart 8: Percentage of consumers whose peak-period packet loss was less than 0.4%, between 0.4% to 1%, and greater than 1%
- Chart 9: Average webpage download time, by advertised download speed
- Chart 10.1: Weighted average advertised upload speed among the top 80% service tiers offered by each ISP
- Chart 10.2: Weighted average advertised upload speed offered by ISPs using DSL technology
- Chart 10.3: Weighted average advertised upload speed offered by ISPs using Cable technology.
- Chart 11: Weighted average advertised upload speed among the top 80% service tiers based on technology
- Chart 12.1: The ratio of median download speed to advertised download speed
- Chart 12.2: The ratio of median upload speed to advertised upload speed.
- Chart 13: The percentage of consumers whose median upload speed was (a) greater than 95%, (b) between 80% and 95%, or (c) less than 80% of the advertised upload speed
- Chart 14.1: Complementary cumulative distribution of the ratio of median download speed to advertised download speed
- Chart 14.2: Complementary cumulative distribution of the ratio of median download speed to advertised download speed (continued)
- Chart 14.3: Complementary cumulative distribution of the ratio of median download speed to advertised download speed, by technology
- Chart 14.4: Complementary cumulative distribution of the ratio of median upload speed to advertised upload speed
- Chart 14.5: Complementary cumulative distribution of the ratio of median upload speed to advertised upload speed (continued)
- Chart 14.6: Complementary cumulative distribution of the ratio of median upload speed to advertised upload speed, by technology
- Chart 15.1: The ratio of weighted median download speed to advertised download speed, peak hours versus off-peak hours
- Chart 15.2: The ratio of weighted median upload speed to advertised upload speed, peak versus off-peak
- Chart 16: The ratio of median download speed to advertised download speed, Monday-to-Friday, two-hour time blocks, terrestrial ISPs
- Chart 17.1: The ratio of 80/80 consistent upload speed to advertised upload speed
- Chart 17.2: The ratio of 70/70 consistent download speed to advertised download speed
- Chart 17.3: The ratio of 70/70 consistent upload speed to advertised upload speed
- Chart 18: Latency for Terrestrial ISPs, by technology, and by advertised download speed.
- Chart 19.1: The ratio of median download speed to advertised download speed, by ISP (1.5-10 Mbps)
- Chart 19.2: The ratio of median download speed to advertised download speed, by ISP (12-18 Mbps)
- Chart 19.3: The ratio of median download speed to advertised download speed, by ISP (18-25 Mbps)
- Chart 19.4: The ratio of median download speed to advertised download speed, by ISP (40-70 Mbps)
- Chart 19.5: The ratio of median download speed to advertised download speed, by ISP (80-100 Mbps)
- Chart 19.6: The ratio of median download speed to advertised download speed, by ISP (150-200 Mbps)
- Chart 19.7: The ratio of median download speed to advertised download speed, by ISP (250-500 Mbps)
- Chart 20.1: The ratio of median upload speed to advertised upload speed, by ISP (0.512 - 1 Mbps)
- Chart 20.2: The ratio of median upload speed to advertised upload speed, by ISP (1.5–5 Mbps)
- Chart 20.3: The ratio of median upload speed to advertised upload speed, by ISP (10-20 Mbps)
- Chart 20.4: The ratio of median upload speed to advertised upload speed, by ISP (30-75 Mbps)
- Chart 20.5: The ratio of median upload speed to advertised upload speed, by ISP (100-200 Mbps)
- Chart 21.1: The percentage of consumers whose median download speed was greater than 95%, between 80% and 95%, or less than 80% of the advertised download speed, by service tier (DSL)
- Chart 21.2: The percentage of consumers whose median download speed was greater than 95%, between 80% and 95%, or less than 80% of the advertised download speed (cable)
- Chart 21.3: The percentage of consumers whose median download speed was greater than 95%, between 80% and 95%, or less than 80% of the advertised download speed (fiber)
- Chart 22.1: The percentage of consumers whose median upload speed was greater than 95%, between 80% and 95%, or less than 80% of the advertised upload speed (DSL)
- Chart 22.2: The percentage of consumers whose median upload speed was greater than 95%, between 80% and 95%, or less than 80% of the advertised upload speed (cable)
- Chart 22.3: The percentage of consumers whose median upload speed was greater than 95%, between 80% and 95%, or less than 80% of the advertised upload speed (fiber)
- Chart 23.1: Average webpage download time, by ISP (1.1-10 Mbps)
- Chart 23.2: Average webpage download time, by ISP (12-15 Mbps)
- Chart 23.3: Average webpage download time, by ISP (18-25 Mbps)
- Chart 23.4: Average webpage download time, by ISP (40-75 Mbps)
- Chart 23.5: Average webpage download time, by ISP (80-100 Mbps)
- Chart 23.6: Average webpage download time, by ISP (150-200 Mbps)
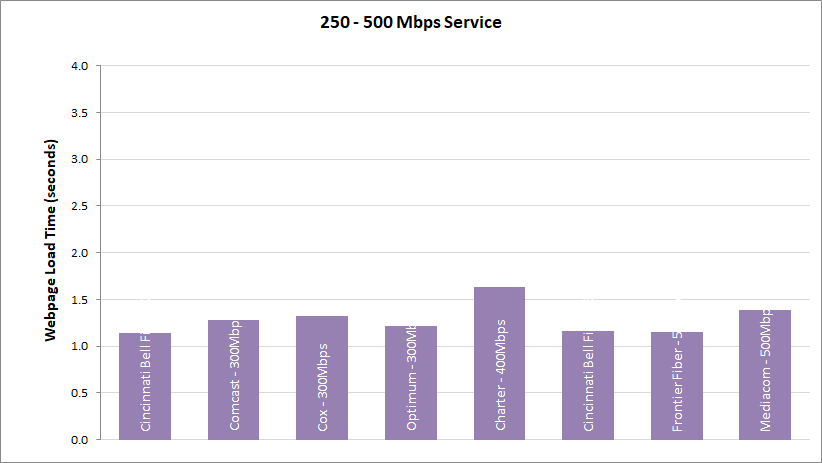
- Chart 23.7: Average webpage download time, by ISP (250-500 Mbps)
- Chart A.1: Percentage change of average download speed for each ISP as compared to the pre-pandemic value on March 1, 2020
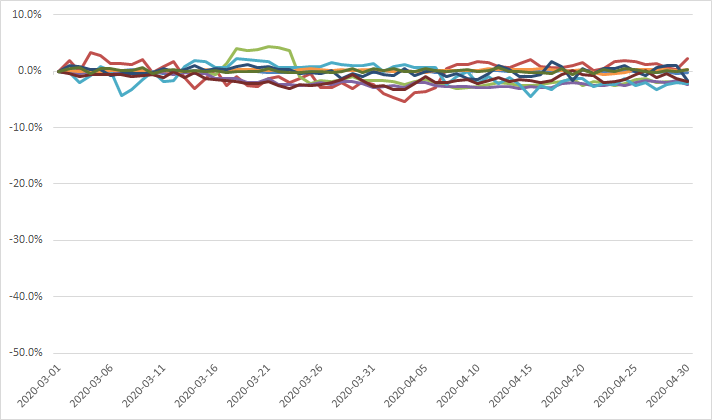
- Chart A.2: Percentage change of average upload speed for each ISP as compared to the pre-pandemic value on March 1, 2020
- Chart A.3: Percentage change of average latency for each ISP as compared to the pre-pandemic value on March 1, 2020
- Chart A.4: Percentage change of average packet loss for each ISP as compared to the pre-pandemic value on March 1, 2020
- Table 1: The most popular advertised service tiers
- Table 2: Peak Period Median download speed, by ISP
- Table 3: Complementary cumulative distribution of the ratio of median download speed to advertised download speed, by technology, by ISP
- Table 4: Complementary cumulative distribution of the ratio of median upload speed to advertised upload speed, by technology, by ISP
1. Executive Summary
The Eleventh Measuring Broadband America Fixed Broadband Report (“Eleventh Report” or “Report”) contains validated data collected in September and October 2020[1] from fixed Internet Service Providers (ISPs) as part of the Federal Communication Commission (FCC)’s Measuring Broadband America (MBA) program. This program is an ongoing rigorous nationwide study of consumer broadband performance in the United States. The goal of this program is to measure the network performance realized on a representative sample of service offerings and the residential broadband consumer demographic across the country.[2] This representative sample is referred to as the MBA “panel.” Thousands of volunteer panelists are drawn from the subscriber bases of ISPs, which collectively serve a large percentage of the residential marketplace.
The initial Measuring Broadband America Fixed Broadband Report was published in August 2011[3] and presented the first broad-scale study of directly measured consumer broadband performance throughout the United States. Including this current Report, eleven reports have now been issued.[4] These reports provide a snapshot of fixed broadband Internet access service performance in the United States utilizing a comprehensive set of performance metrics. As part of an open data program, all methodologies used in the program are fully documented, and all collected data is published for public use without any restrictions. The collected performance data can be used for various additional studies and analysis.
For the period covered by this Eleventh Report, the coronavirus pandemic had a significant impact on each of the metrics tracked by the Measuring Broadband America program. A national emergency was declared in the United Sates on March 13, and by the time the validated data collection period for this Report was underway, approximately 42% of the U.S. workforce was working remotely from their homes.[5] Similarly, 93% of households reported some form of remote learning and distance education during this time period.[6] The 2020 data would reflect these developments, as well as the impacts of various measures taken by the Federal Communications Commission and other federal actors to manage the crisis and support recovery. Despite all the challenges, the MBA measurements showed that for the most part, the ISP networks were able to keep up with this unprecedented increased load on their networks, as will be evidenced by the results presented in this report
A. Major Findings Of The Eleventh Report
The key findings of this report are:
- The maximum advertised download speeds amongst the service tiers offered by ISPs and measured by the FCC ranged from 100 Mbps to 1,000 Mbps for the period covered by this report.
- The weighted average advertised speed of the participating ISPs was193.9 Mbps, representing an increase of33% from the previous year’s Tenth Report and over 43% from the Ninth Report.
- For most of the major broadband providers that were tested, measured download speeds were 100% or better than advertised speeds during the peak hours (7 p.m. to 11 p.m. local time).
- Ten ISPs were evaluated in this report. Of these, CenturyLink, Cincinnati Bell, and Frontier employed multiple different broadband technologies across the U.S, whereas the rest were single technology providers. Overall, 12 different ISP/technology configurations were evaluated in this report; nine performed at or better than their advertised speed during the peak hours. One performed below 90% for actual-to-advertised download speed during the peak hours.
- In addition to providing download and upload speed measurements of ISPs, this report also provides a measure of consistency of measured-to-advertised speeds of ISPs with the use of our “80/80” metric. The 80/80 metric measures the percentage of the advertised speed that at least 80% of subscribers experience at least 80% of the time over peak periods. By this measure, seven of the 12 ISP/technology configurations performed at or better than 95% of their advertised speed during the peak hours. Two of the 12 ISP/technology configurations provided lower than 75% of advertised speed to at least 80% of panelists for at least 80% of the time.
These and other findings are described in greater detail within this report.
B. Speed Performance Metrics
Speed (both download and upload) performance continues to be one of the key metrics reported by the MBA. The data presented includes each ISP’s broadband performance as the median[7] of speeds experienced by panelists within a specific service tier. These reports mainly focus on common service tiers used by an ISP’s subscribers.[8]
Additionally, consistent with previous Reports, we also compute average per-ISP performance by weighting the median speed for each service tier by the number of subscribers in that tier. Similarly, in calculating the composite average speed, taking into account all ISPs in a specific year, the median speed of each ISP is used and weighted by the number of subscribers of that ISP as a fraction of the total number of subscribers across all ISPs.
In calculating these weighted medians, we draw on two sources for determining the number of subscribers per service tier. ISPs may voluntarily contribute subscription demographics per surveyed service tier as the most recent and authoritative data. Many ISPs have chosen to do so.[9] When such information is not provided by an ISP, we instead rely on the FCC’s Form 477 data.[10] All facilities-based broadband providers are required to file data with the FCC twice a year via Form 477 regarding deployment of broadband services, including subscriber counts. For this report, we used the June 2019 Form 477 data.
As in our previous reports, we found that, for most ISPs (except for a few DSL providers and one fiber provider), the measured speeds experienced by subscribers either nearly met or exceeded advertised service tier speeds. However, since we started the MBA program, consumers have changed their Internet usage habits. In 2011, consumers mainly browsed the web and downloaded files; thus, we reported mean broadband speeds since these statistics were likely to closely mirror user experience. Consumer internet usage has now become dominated by video consumption, with consumers regularly streaming video for entertainment and education[11] Our network performance analytics were expanded to use consistency in service metrics to better capture the shift in usage patterns. Using both median measured speed and consistency in service metrics better reflects the consumer’s perception and usefulness of Internet access service given this shift in usage habits.
We use two kinds of metrics to reflect the consistency of service delivered to the consumer: First, we report the percentage of advertised speed experienced by at least 80% of panelists during at least 80% of the daily peak usage period (“80/80 consistent speed” measure). Second, we show the fraction of consumers who obtain median speeds greater than 95%, between 80% and 95%, and less than 80% of advertised speeds.
C. Use Of Other Performance Metrics
Although download and upload speeds remain the network performance metric of greatest interest to the consumer, we also spotlight two other key network performance metrics in this report: latency and packet loss. These metrics can affect significantly the overall quality of Internet applications.
Packet loss measures the fraction of data packets sent that fail to be delivered to the intended destination. Packet loss may affect the perceived quality of applications that do not incorporate retransmission of lost packets, such as phone calls over the Internet, video chat, certain online multiplayer games, and certain video streaming services. During network congestion, both latency and packet loss typically increase. High packet loss degrades the achievable throughput of download and streaming applications. However, packet loss of a few tenths of a percent, for example, is common and is unlikely to affect significantly the perceived quality of most Internet applications.
The Internet continually evolves in its architecture, performance, and services. Accordingly, we will continue to adapt our measurement and analysis methodologies to further improve the collective understanding of performance characteristics of broadband Internet access. By doing so we aim to help the community of interest across the board, including consumers, technologists, service providers, and regulators.
2. Summary of Key Findings
A.Most Popular Advertised Service Tiers
A list of the ISP download and upload speed service tiers that were measured in this report are shown in Table 1. It should be noted that while upload and download speeds are measured independently and shown separately, they typically are offered by an ISP in a paired configuration. The service tiers that are included for reporting represent the top 80% (therefore ‘most popular’) of an ISP’s set of tiers based on subscriber numbers. Taken in aggregate, these plans serve the majority of the subscription base of the ISPs across the USA.
Table 1: List of ISP service tiers whose broadband performance was measured in this report
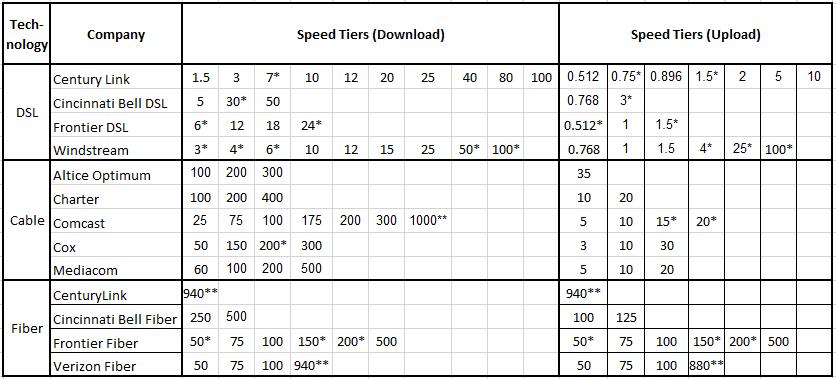 *Tiers that lack sufficient panelists to meet the program’s target sample size.
** Tiers near Gigabit speeds whose technical methodologies for reporting have not yet been established for the MBA program. We note that a Technical Working Group including providers of these tiers has been created to evaluate different test methodologies for reporting on results for 940 Mbps and above download speeds.
Chart 1.1 (below) displays the weighted (by subscriber numbers) mean of the top 80% advertised download speed tiers for each participating ISP for the last four years (September 2017 to September-October 2020) grouped by the access technology used to offer the broadband Internet access service (DSL, cable, or fiber). It should be noted that this chart only aims to represent the weighted average of the ISP’s advertised speeds as one index to track broadband service evolution; it does not reflect the measured performance of the ISPs. As far as a further composite index across the entirety of the ISPs in the MBA sample, in September-October 2020, the weighted average advertised download speed was 193.9 Mbps among the measured ISPs, which represents a 33% increase compared to the average, in September-October 2019, of 146.1 Mbps (as in the Tenth MBA Report) and a 166% increase compared to the 2017 of 72.9 Mbps[12] (as shown in the Eighth MBA Report).
Chart 1.1: Weighted average advertised download speed among the top 80% service tiers offered by each ISP
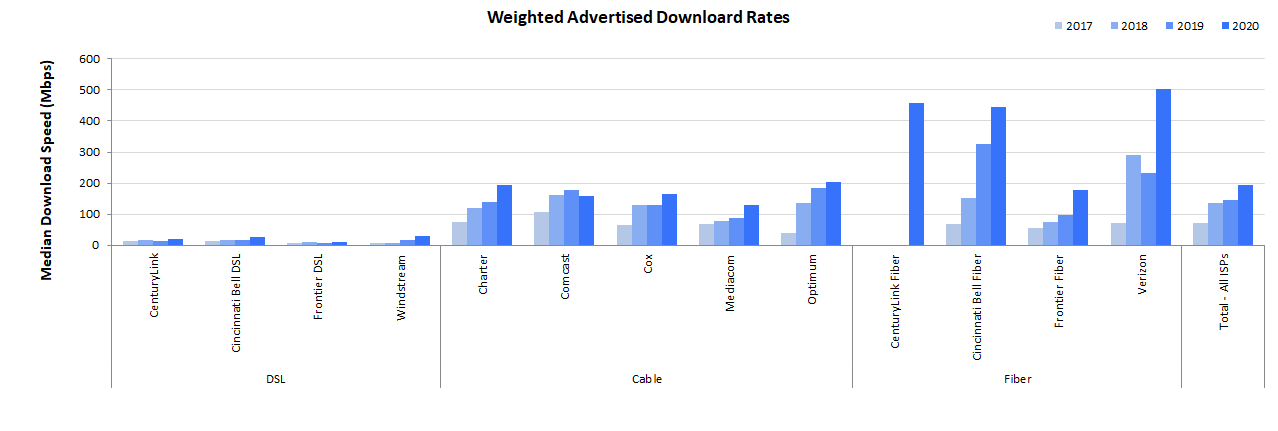
Nearly all of the ISPs had higher weighted averages of advertised speeds in September-October 2020 as compared to September-October 2019.
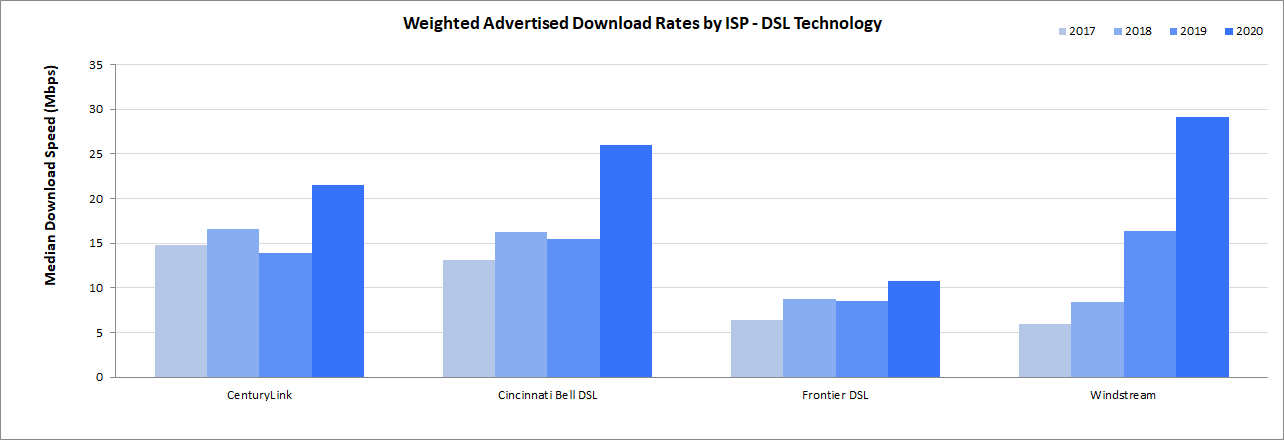
Chart 1.1 reflects that DSL speeds lag far behind the speed of other technologies. In order to better compare the DSL speed offerings by the various ISPs, we have added a separate Chart 1.2 drawn to a scale that makes their relative speeds more apparent.
Chart 1.2: Weighted average advertised download speed among the DSL ISPs
As can be seen in Chart 1.1, there is considerable difference between the offered average weighted speed tier by technology. Chart 2 plots the weighted average of the top 80% ISP tiers by technology for the last four years.[13] All technologies showed increases in the set of advertised download speeds by ISPs. For the September-October 2020 period, the weighted mean advertised speeds for DSL technology was 21 Mbps, which lagged considerably behind the weighted mean advertised download speeds for cable and fiber technologies of 178 Mbps and 447 Mbps, respectively. DSL technology speed increased from 13 Mbps to 21 Mbps from 2019 to 2020, a 60% increase. In comparison, cable technology showed an 15% increase in weighted mean advertised download speed from 2019 to 2020. The largest increase in weighted average advertised speeds, however, was for Fiber technology, which showed a 114% increase from 2019 to 2020.
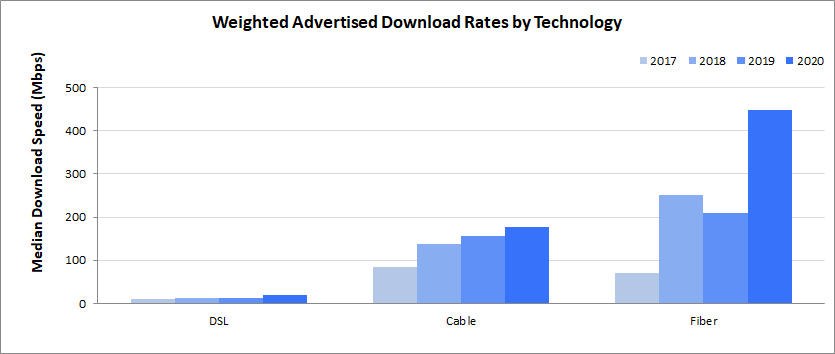
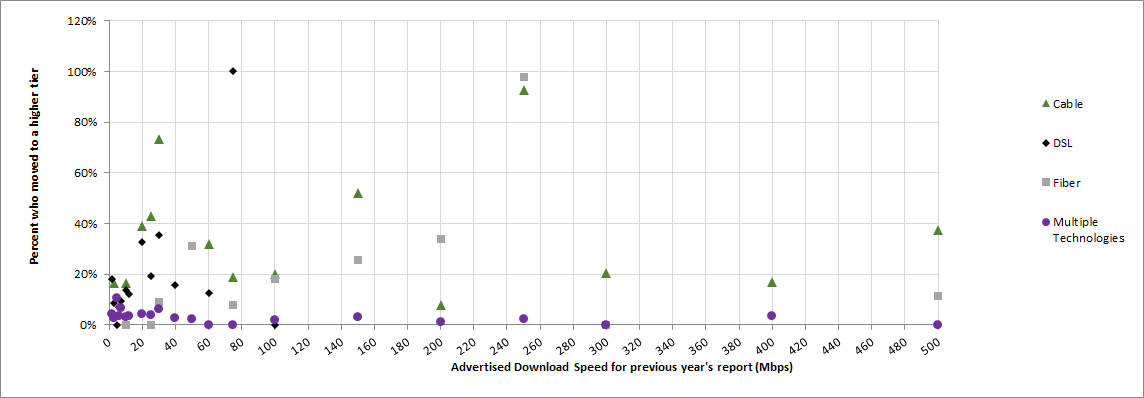
Chart 3 plots the migration of panelists to a higher service tier based on their access technology.[14] Specifically, the horizontal axis of Chart 3 partitions the September-October 2019 panelists by the advertised download speed of the service tier to which they were subscribed. For each such set of panelists who also participated in the September-October 2020 collection of data,[15] the vertical axis of Chart 3 displays the percentage of panelists that migrated by September-October 2020 to a service tier with a higher advertised download speed. There are two ways that such a migration could occur: (1) panelist may have changed their broadband plan during the intervening year to a service tier with a higher advertised download speed, or (2) a panelist the panelist’s ISP increased the advertised download speed of the panelist’s existing subscribed plan.[16]
Chart 3 shows that the percentage of panelists subscribed in September-October 2019 who moved to higher tiers in September-October2020 was between 3% to 25% for DSL subscribers, 5% to 58% for cable subscribers, and 5% to 74% for fiber subscribers. Interestingly, a large number of subscribers, between 30% to 60%, migrated to a higher speed tier using a different technology from what they had in September-October2019.This is in sharp contrast to the previous year when only 1% to 8% of subscribers migrated to a different technology. It is possible that with the increased reliance on use of home networks for performing school and work-related activities during the COVID-19 pandemic, many consumers may have migrated away from older and slower speed technologies such as DSL. [17]
Chart 3: Consumer migration to higher advertised download speeds
B. Median download speeds
Advertised download speeds may differ from the actual speeds that subscribers experience. Some ISPs meet network service objectives more consistently than others; some meet such objectives unevenly across their geographic coverage area. Also, speeds experienced by a consumer may vary during the day if the aggregate user demand during busy hours causes network congestion. Unless stated otherwise, the data used in this report is based on measurements taken during peak usage periods, which we define as 7 p.m. to 11 p.m. local time.[18]
To compute each ISP’s overall performance inclusive of all sampled tiers, we determine the ratio of the median speed for each tier to the advertised tier speed and then calculate the weighted average of these based on the subscriber count per tier. Subscriber counts for the weightings were provided from the ISPs themselves or, if unavailable, from FCC Form 477 data.
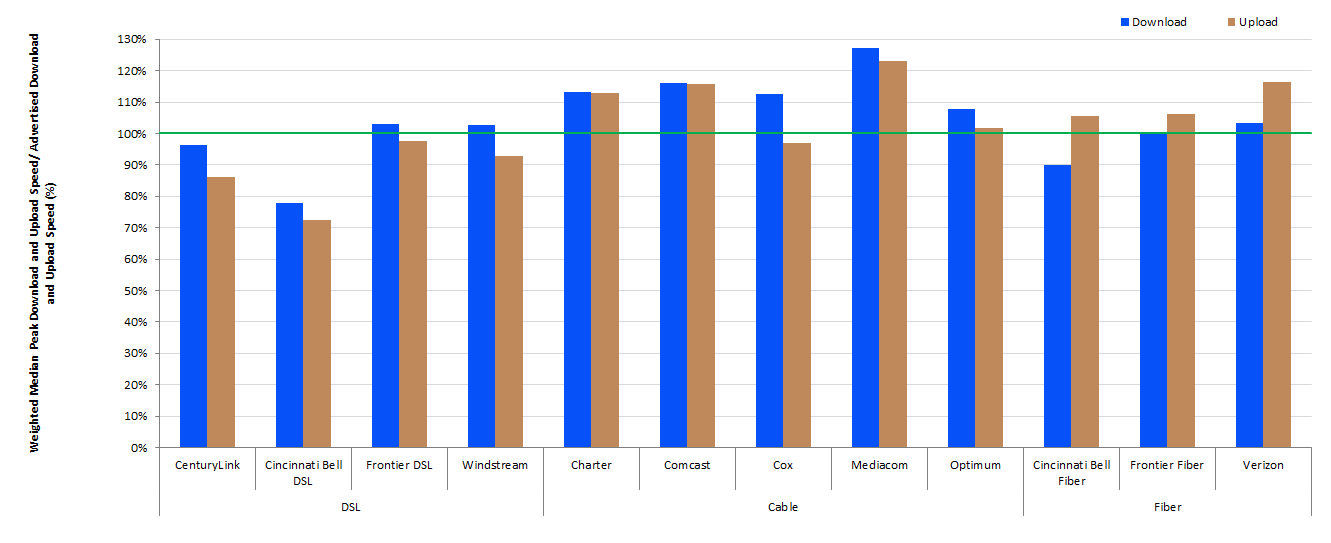
Chart 4 shows the ratio of the measured median download and upload speeds experienced by an ISP’s subscribers to that ISP’s advertised download and upload speeds weighted by the subscribership numbers for the tiers. The actual speeds experienced by the subscribers of most ISPs are close to or exceed the advertised speeds. DSL broadband ISPs, however, continue to advertise “up-to” speeds that, on average, exceed the actual speeds experienced by their subscribers. Out of the 12 ISP/technology configurations shown, 9 met or exceeded their advertised download speeds, and two more reached at least 90% of their advertised download speed. Only Cincinnati Bell DSL (at 78%) performed below 90% of its advertised download speed.
The upload speed performance followed a similar trend to the download speed performance, with 7 of the 12 ISP/technologies exceeding their advertised upload speed, and 2 falling below 90% of the advertised upload speed.
Chart 4: The ratio of weighted median speed (download and upload) to advertised speed for each ISP.
C. Variations In Performance/Measured speeds
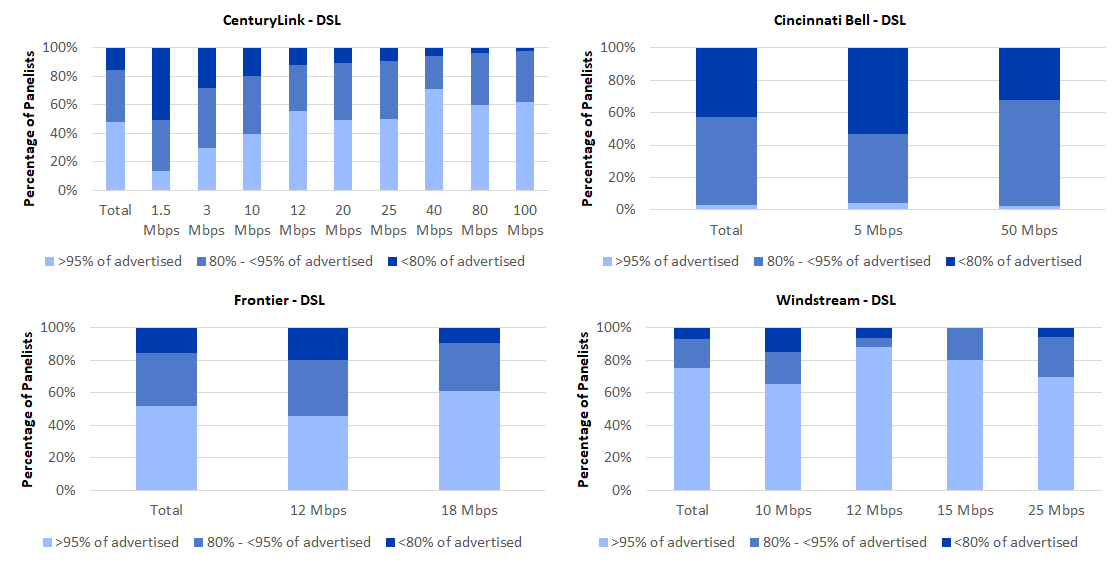
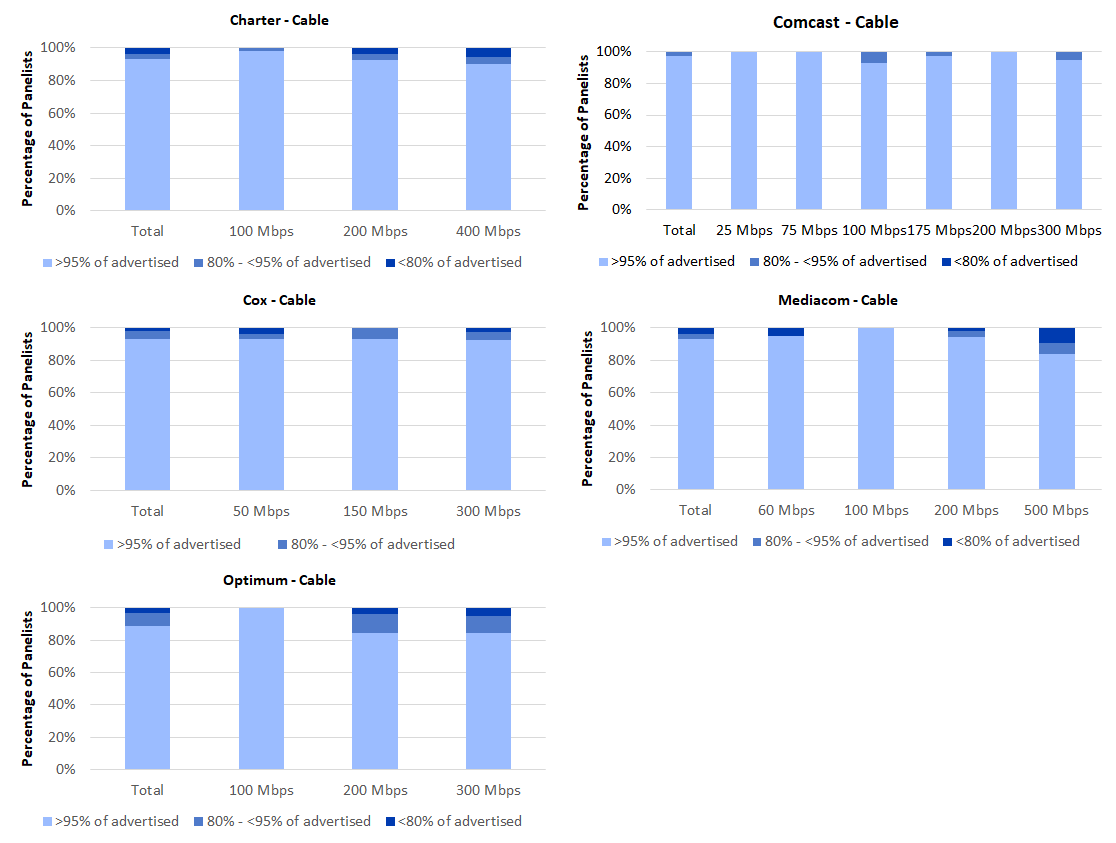
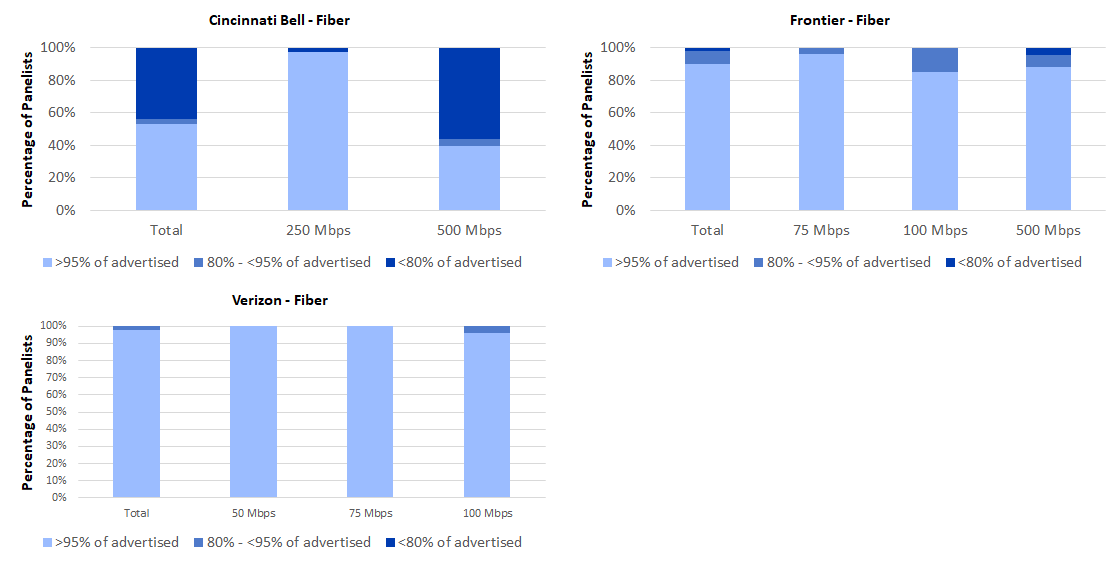
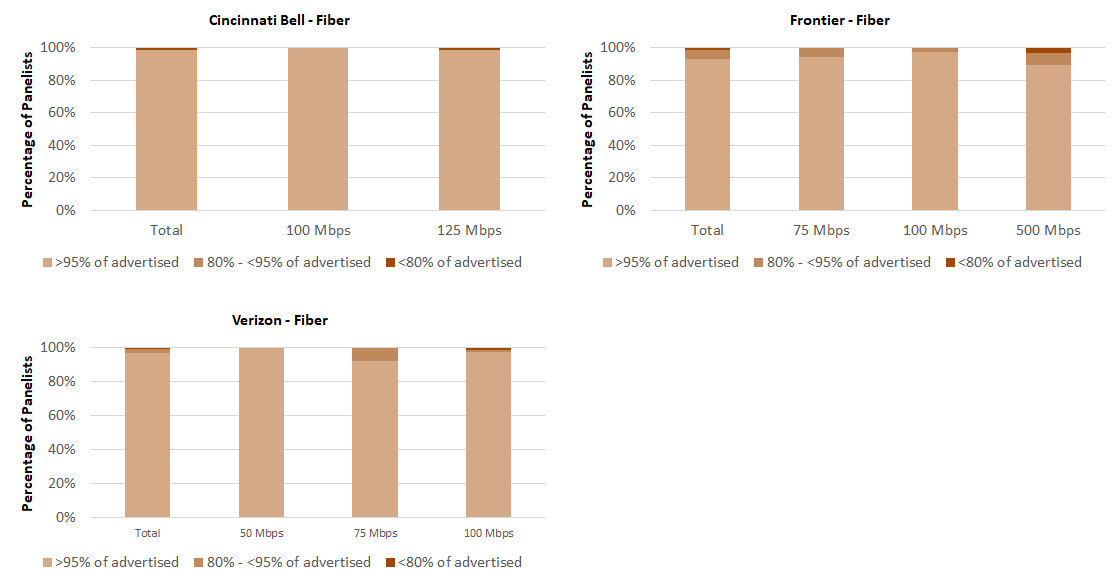
As discussed earlier, actual speeds experienced by individual consumers may vary by location and time of day. Chart 5 shows, for each ISP, the percentage of panelists who experienced a median download speed (averaged over the peak usage period during our measurement period) that was greater than 95%, between 80% and 95%, or less than 80% of the advertised download speed.
Chart 5: The percentage of consumers whose median download speed was greater than 95%, between 80% and 95%, or less than 80% of the advertised download speed

Between 3% to 75% of subscribers of ISPs using DSL technology experienced speeds greater than or equal to 95% of their respective ISP’s advertised download speeds during peak hours. ISPs using cable technology and fiber technology provided speeds equal to or better than 95% of their advertised speeds to between 89%-98% and 53%-98% of their subscribers, respectively.
Though the median download speeds experienced by most ISPs’ subscribers nearly met or exceeded the advertised download speeds, there were a number of customers of each ISP for whom the median download speed fell significantly short of the advertised download speed. The best performing ISPs, when measured by this metric, were Charter, Comcast, Cox, Mediacom, Optimum, Frontier-Fiber and Verizon-Fiber; more than 88% of their panelists experienced an actual median download speed of at least 95% of the advertised download speed.
In addition to variations based on a subscriber’s location, speeds experienced by a consumer may fluctuate during the day. This typically is caused by increased traffic demand and the resulting stress on different parts of the network infrastructure. To examine this aspect of performance, we use the term “80/80 consistent speed.” This metric is designed to assess temporal and spatial variations in measured values of a user’s download speed.[19] While consistency of speed is in itself an intrinsically valuable service characteristic, its impact on consumers will hinge on variations in usage patterns and needs. As an example, a good consistency of speed measure is likely to indicate a higher quality of service experience for internet users consuming video content.
Chart 6 summarizes, for each ISP, the ratio of 80/80 consistent median download speed to advertised download speed, and, for comparison, the ratio of median download speed to advertised download speed shown previously in Chart 4. The ratio of 80/80 consistent median download speed to advertised download speed was less than the ratio of median download speed to advertised download speed for all participating ISPs due to congestion periods when median download speeds were lower than the overall average. The size of the difference between these two ratios is indicative of the variability of median download speed: when the difference between these two ratios is small, the median download speed is fairly insensitive to both geography and time; in contrast, when the difference between the two ratios is large, there is a greater variability in median download speed, either across a set of different locations or across different times during the peak usage period at the same location.
Chart 6: The ratio of 80/80 consistent median download speed to advertised download speed.
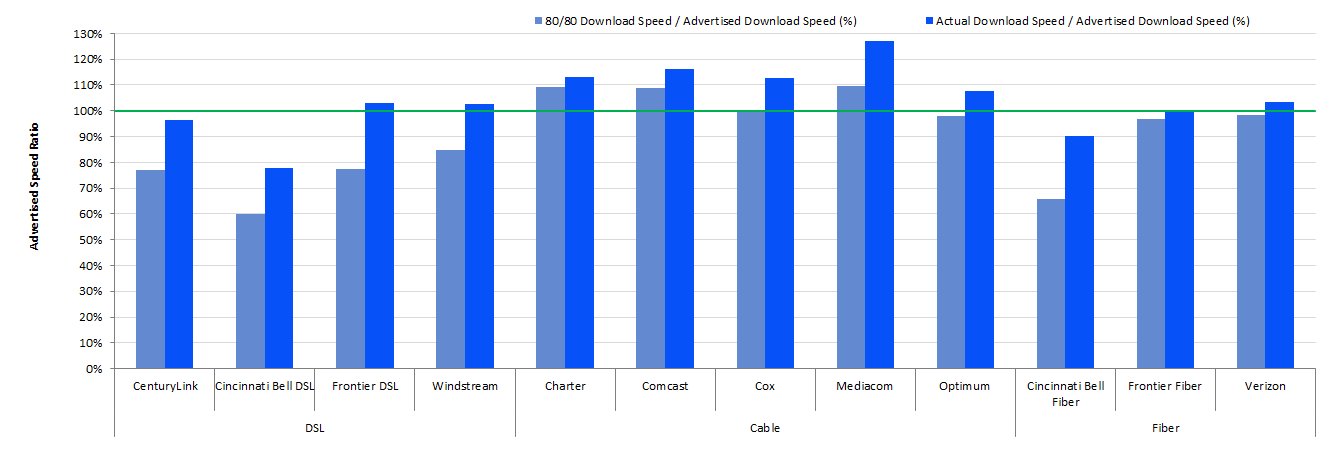
As can be seen in Chart 6, cable and fiber ISPs performed better than DSL ISPs with respect to their provision of consistent speeds. Customers of Charter, Comcast, Cox, Mediacom, Optimum, Frontier Fiber, and Verizon, for example, experienced median download speeds that were very consistent; i.e., they provided greater than 95% of the advertised speed during peak usage period to more than 80% of panelists for more than 80% of the time. In particular, Charter, Comcast, Cox and Mediacom provided 100% or greater than their advertised speed during the peak usage period to more than 80% of their panelists for more than 80% of the time. In contrast, the 80/80 consistent download speed for Cincinnati Bell DSL was 46% of the advertised speed.
D.Latency
The latency between any two points in the network is the time it takes for a packet to travel from one point to the other. It has a fixed component that depends on the distance, the transmission speed, and transmission technology between the source and destination, and a variable component due to queuing delay that increases as the network path congests with traffic. The MBA program measures latency by measuring the round-trip time between the consumer’s home and the closest measurement server.
Chart 7 shows the median latency for each participating ISP. In general, higher speed service tiers have lower latency, as it takes less time to transmit each packet. The measured median latencies ranged from 8 ms to 28 ms (with the exception of CenturyLink DSL, for which the median latency measure was 37 ms).

Measured DSL latencies (between 21 ms to 37 ms) were slightly higher than those for cable (12 ms to 26 ms), and latencies were lowest for fiber ISPs (8 ms to 13 ms).
E. Packet Loss
Packet loss is the percentage of packets that are sent by a source but not received at the intended destination. The most common causes of packet loss are congestion leading to buffer overflows or active queue management along the network path. Alternatively, high latency might lead to a packet being counted as lost if it does not arrive within a specified window. A small amount of packet loss is expected, and indeed packet loss commonly is used by some Internet protocols such as TCP to infer Internet congestion and to adjust the sending rate to mitigate the offered load, thus lessening the contribution to congestion and the risk of lost packets. The MBA program uses an active UDP-based packet loss measurement method and considers a packet lost if it is not returned within 3 seconds.
Chart 8 shows the average peak-period packet loss for each participating ISP, separated into three groups based on technology used for the access network. The average peak-period packet loss performance is represented in three bands based on commonly accepted packet loss thresholds for specific services and typical packet loss limits in provider Service Level Agreements (SLAs) for enterprise services (as consumer offerings typically are not subject to SLAs). Separating the packet loss performance into these three bands allows a more granular view of the packet loss performance of the ISP network. The breakpoints for the three bands are: up to 0.4% packet loss, 0.4% - 1% packet loss, and over 1% packet loss. The 1% standard for packet loss is commonly accepted as the point at which highly interactive applications such as VoIP experience significant degradation in quality according to industry publications and international (ITU) standards.[20] The specific value of 0.4%, roughly the middle ground between the highly desirable performance of 0% packet loss described in many documents for Voice of Internet Protocol (VoIP), generally is supported by major ISP SLAs for network. Indeed, most SLAs support 0.1% to 0.3% packet loss guarantees,[21] but these are generally for enterprise level services which entail business-critical applications that require some service guarantees.
Chart 8: Percentage of consumers whose peak-period packet loss was less than 0.4%, between 0.4% to 1%, and greater than 1%.
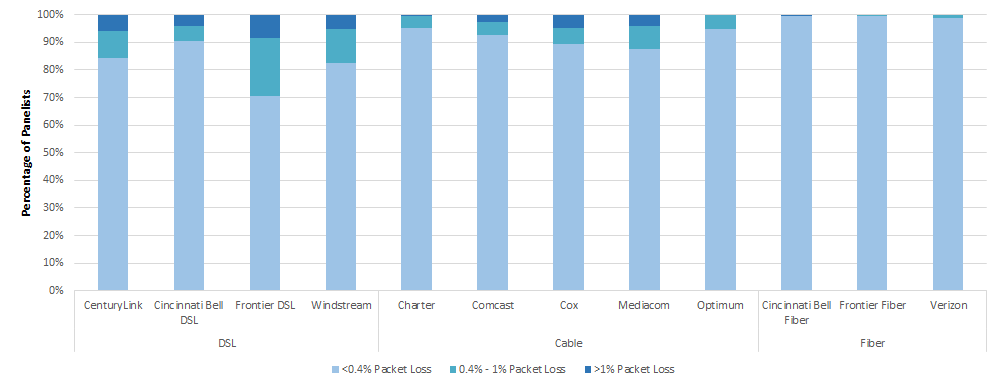
Chart 8 shows that ISPs using fiber technology have the lowest packet loss, and that ISPs using DSL technology tend to have the highest packet loss. As shown in this chart, 4% to 8% of DSL subscribers experience 1% or greater packet loss. The corresponding numbers for cable and fiber are 0% to 5% and 0% to 0.6%, respectively. Within a given technology class, packet loss also varies among ISPs. It should be noted that most ISPs use fiber for their backbone irrespective of the access technology they may deploy.
F. Web browsing performance
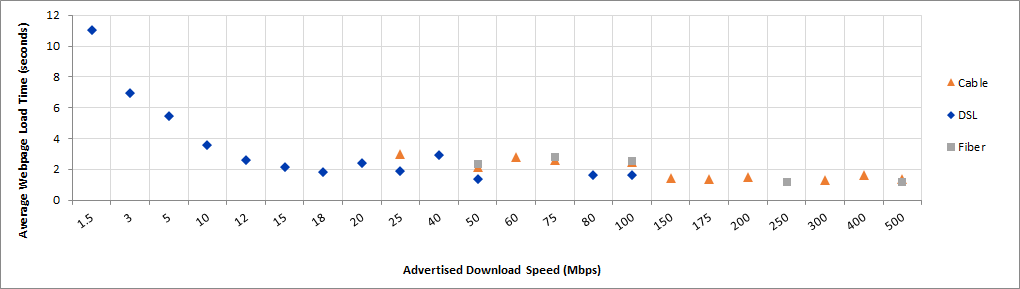
The MBA program also conducts a specific test to gauge web browsing performance. The web browsing test accesses nine popular websites that include text and images, but not streaming video. The time required to download a webpage depends on many factors, including the consumer’s in-home network, the download speed within an ISP’s network, the web server’s speed, congestion in other networks outside the consumer’s ISP’s network (if any), and the time required to look up the network address of the webserver. Only some of these factors are under the control of the consumer’s ISP. Chart 9 displays the average webpage download time as a function of the advertised download speed. As shown by this chart, webpage download time decreased as download speed increased, from about 11 seconds at 1.5 Mbps download speed to about 1.9 seconds for 25 Mbps download speed. Subscribers to service tiers exceeding 25 Mbps experienced slightly smaller webpage download times decreasing to 1.4 seconds at 175 Mbps. Beyond 175 Mbps, the webpage download times decreased only by minor amounts. These download times assume that only a single user is using the Internet connection when the webpage is downloaded; our testing does not account for additional common scenarios, such as where multiple users within a household are simultaneously using the Internet connection for viewing web pages, as well as other applications such as real-time gaming or video streaming.
Chart 9: Average webpage download time, by advertised download speed.
3. Methodology
A. Participants
Eleven ISPs actively participated in the Fixed MBA program in September-October 2020. They were:
- Altice Optimum
- CenturyLink
- Charter Communications
- Cincinnati Bell
- Comcast
- Cox Communications
- Frontier Communications Company
- Hawaiian Telecom [22]
- Mediacom Communications Corporation
- Verizon
- Windstream Communications
The methodologies and assumptions underlying the measurements described in this Report are reviewed at meetings that are open to all interested parties; these meetings are documented in public ex parte letters filed in the GN Docket No. 12-264. Policy decisions regarding the MBA program were discussed at these meetings prior to adoption, and involved issues such as inclusion of tiers, length of test periods, mitigation of operational issues affecting the measurement infrastructure, and terms of use for notification to panelists. Participation in the MBA program is open and voluntary. Participants include members of academia, consumer equipment vendors, telecommunications vendors, network service providers, consumer policy groups, and the FCC’s contractor for this project, SamKnows. In 2020-2021, participants at these meetings (collectively and informally referred to as “the FCC MBA broadband collaborative”), included all eleven participating ISPs and the following additional organizations:
- AT&T
- Level 3 Communications (“Level 3”), now part of CenturyLink
- Massachusetts Institute of Technology (“MIT”)
- StackPath
- NCTA – The Internet & Television Association (“NCTA”)
- New America Foundation
- Princeton University
- United States Telecom Association (“US Telecom”)
- University of California - Santa Cruz
- University of Chicago
Participants have contributed in important ways to the integrity of this program and have provided valuable input to FCC decisions for this program. Initial proposals for test metrics and testing platforms were discussed and critiqued within the broadband collaborative. We thank all the participants for their continued contributions to the MBA program.
B. Measurement process
The measurements that provided the underlying data for this report were conducted between MBA measurement clients and MBA measurement servers. The measurement clients (i.e., whiteboxes) were situated in the homes of 5,951 panelists, each of whom received service from one of the 10 evaluated ISPs. The evaluated ISPs collectively represent over 70% of U.S. residential broadband Internet connections. After the measurement data was processed (as described in greater detail in the Technical Appendix), test results from 2,488 panelists were used in this report[24] .
The measurement servers used by the MBA program were hosted by StackPath, and Level 3 Communications, and were located in thirteen cities (often with multiple locations within each city) across the United States near a point of interconnection between the ISP’s network and the network on which the measurement server resided.
The measurement clients collected data throughout the year, and this data is available as described below. However, only data collected from September 2 – 24, 2020 (inclusive) plus September 26 – October 2, 2020 (inclusive), referred to throughout this report as the “September-October 2020 reporting period,” were used to generate the charts and conclusions in this Report.[25]
Broadband performance varies with the time of day. At peak hours, more people tend to use their broadband Internet connections, giving rise to a greater potential for network congestion and degraded user performance. Unless otherwise stated, this Report focuses on performance during peak usage period, which is defined as weeknights between 7:00 p.m. to 11:00 p.m. local time at the subscriber’s location. Focusing on peak usage period provides the most useful information because it demonstrates what performance users can expect when Internet access services in their local area experience the highest demand from users. As shown in the Annex to this Report, it should be noted that the peak period remained the same despite the increased number of people working from home due to the pandemic.
Our methodology focuses on the performance of each of the participating ISP’s access network. The metrics discussed in this Report are derived from active measurements, i.e., test-generated traffic flowing between a standalone measurement client, located within a panelist’s home, and a measurement server, located outside the ISP’s network. For each panelist, the tests make a periodically-rerun empirical choice as to the measurement server that has the lowest latency to the measurement client. Thus, the metrics measure performance along the path followed by the measurement traffic within each ISP’s network, through a point of interconnection between the ISP’s network and the network on which the chosen measurement server is located. The service performance that a consumer experiences, however, could differ from our measured values for one or more reasons.
First, as noted above, in the course of each test instance, performance is measured only to a single measurement server rather than to multiple servers. This is consistent with the approach chosen by most network measurement tools, although applications may vary. As a point of comparison, the average web page may load its content from a multiplicity of end points.
In addition, bottlenecks or congestion points in the full path traversed by consumer application traffic also impact a consumer’s perception of Internet service performance. These bottlenecks may exist at various points: within the ISP’s network, beyond its network (depending on the network topology encountered en route to the traffic destination), in the consumer’s home on the Wi-Fi used to connect to the in-home access router, or from a shortfall of capacity at the far end point being accessed by the application. The MBA tests explore how a service performs from the point at which a fixed ISP’s Internet service is delivered to the home on fixed infrastructure (deliberately excluding Wi-Fi, due to the many confounding factors associated with it) to the point at which the test servers are located. As MBA tests are designed to focus on the access to the ISP’s network, they will not include phenomena at most interconnection points or transit networks that consumer traffic may traverse.
Since the MBA program is focused on ISP network performance, and the overall performance a consumer experiences with their service can be affected by congestion that may arise at other points in the path potentially taken by consumer traffic (e.g., in-home Wi-Fi, peering points, transit networks, etc.), the MBA methodologies/system/measurements are designed to recognize and eliminate such confounding factors outside an access ISP’s control.[26] A consumer’s home network, rather than the ISP’s network, may be a bottleneck with respect to congestion. We measure the performance of the ISP’s service delivered to the consumer’s home network, but this service often is shared simultaneously among multiple users and applications within the home. In-home networks, which typically include Wi-Fi, may not have sufficient capacities to support peak loads.[27]
In addition, consumers’ experience of ISP performance is manifested through the set of applications they utilize. The overall performance of an application depends not only on the network performance (i.e., raw speed, latency, or packet loss), but also on the application’s architecture and implementation and on the operating system and hardware on which it runs. While network performance is considered in this Report, application performance is not. To the extent possible, the MBA focuses on performance within an ISP’s network.
C. Measurement Tests And Performance Metrics
This Report is based on the following measurement tests:
- Download speed: This test measures the download speed of each whitebox over a 10-second period, once per hour during peak hours (7 p.m. to 11 p.m.) and once during each of the following periods: midnight to 6 a.m., 6 a.m. to noon, and noon to 6 p.m. The download speed measurement results from each whitebox are then averaged across the measurement month, and the median value for these average speeds across the entire set of whiteboxes on a given tier is used to determine the median measured download speedfor that tier. The overall ISP download speed is computed as the weighted median for each service tier, using the subscriber counts for the tiers as weights.
- Upload speed: This test measures the upload speed of each whitebox over a 10-second period, which is the same measurement interval as the download speed. The upload speed measured in the last five seconds of the 10-second interval is retained, the results of each whitebox are then averaged over the measurement period, and the median value for the average speed taken over the entire set of whiteboxes is used to determine the median upload speed for a service tier. The ISP upload speed is computed in the same manner as the download speed.
- Latency and packet loss: These tests measure the round-trip times for approximately 2,000 packets per hour sent at randomly distributed intervals. Response times less than three seconds are used to determine the mean latency. If the whitebox does not receive a response within three seconds, the packet is counted as lost.
- Web browsing: The web browsing test, performed once every hour, measures the total time it takes to request and receive webpages, including the text and images, from nine popular websites. The measurement includes the time required to translate the web server name (URL) into the webserver’s network (IP) address.
This Report focuses on three key performance metrics of interest to consumers of broadband Internet access service, as these metrics are likely to influence how well a wide range of consumer applications work: download and upload speed, latency, and packet loss. Download and upload speeds also are the primary network performance characteristic advertised by ISPs. However, as discussed above, the performance observed by a user in any given circumstance depends not only on their ISP’s network, but also on the performance of other parts of the Internet and of the application platform used. The Technical Appendix to this Report describes each test in more detail, including additional tests not utilized for the purpose of compiling this Report.
D. MBA data coverage and quality
The MBA panel sample used in the reporting period is validated (i.e., upload and download tiers of the whiteboxes are verified with providers), and the measurement results are carefully inspected to eliminate any statistical outliers. This leads to a ‘validated data set’ that accompanies each report. The Validated Data Set[29] on which this Report is based, as well as the full results of all tests, are available at http://www.fcc.gov/measuring-broadband-america. For interested parties, as tests are run 24x7x365, we also provide raw data (referred to as such because validation cross-checks are not done except in the test period used for the report, thus subscriber tier changes may be missed) for the reference month and the rest of the year. Previous reports of the MBA program, as well as the data used to produce them, also are available at the site listed above.
Both the Commission and SamKnows, the Commission’s contractor for this program, recognize that, while the methodology descriptions included in this document provide an overview of the project, interested parties may be willing to contribute to the project by reviewing the methodology used in the testing. SamKnows welcomes review of its methodology and technical platform, consistent with the Commission’s goals of openness and transparency for this program.[30]
4. Test Results
A. Most Popular Advertised Service Tiers
Chart 1.1 above summarizes the weighted average of the advertised download speed offerings[31] for each participating ISP for the last 4 years (September 2017 to September-October 2020), where the weighting is based upon the number of subscribers to each tier, grouped by the access technology used to offer the broadband Internet access service (DSL, cable, or fiber). Only the top 80% tiers (by subscriber number) of each participating ISP were included. Chart 10 below shows the corresponding weighted average of the advertised upload speeds among the measured ISPs. The computed weighted average of the advertised upload speed of all the ISPs is 56.6 Mbps; this is a 85% increase from 30.5 Mbps in 2019 and a 332% increase from 13.1 Mbps in 2017.[32]
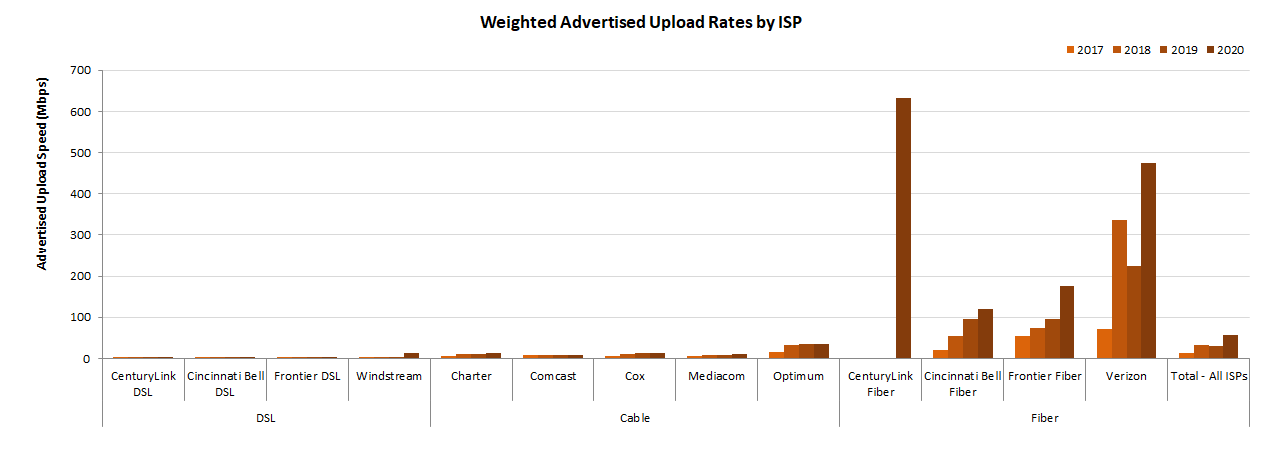
Due to the relatively high upload speeds for optical technology, it is difficult to discern the variations in speed for both DSL and cable technologies when drawn to the same scale. Therefore, separate Charts 10.2 and 10.3 are included here that provide the weighted -average upload speeds for ISPs using DSL and cable technologies, respectively, scaled to a more granular level.
Chart 10.2: Weighted average advertised upload speed offered by ISPs using DSL technology.
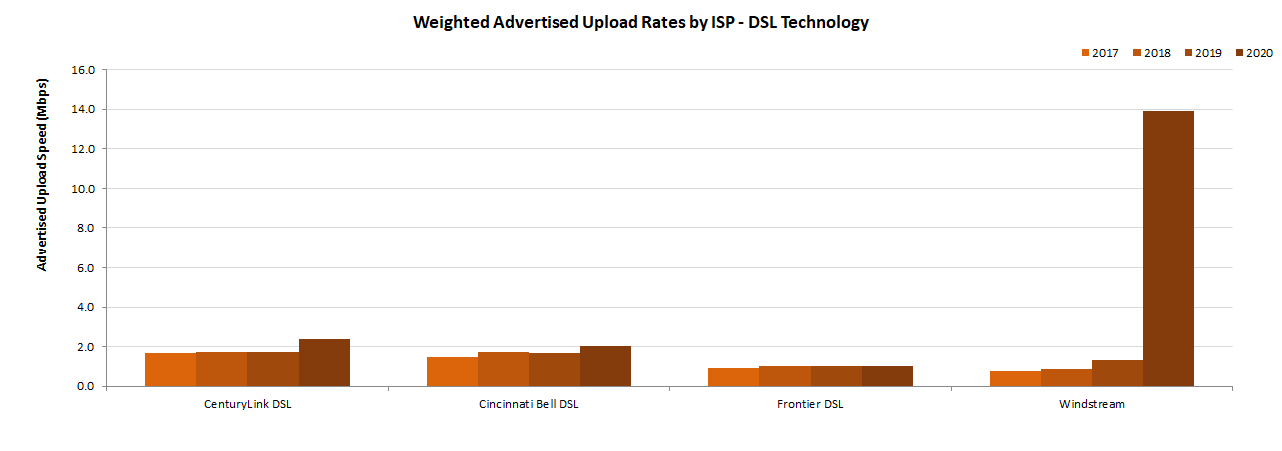
Chart 10.3: Weighted average advertised upload speed offered by ISPs using Cable technology.
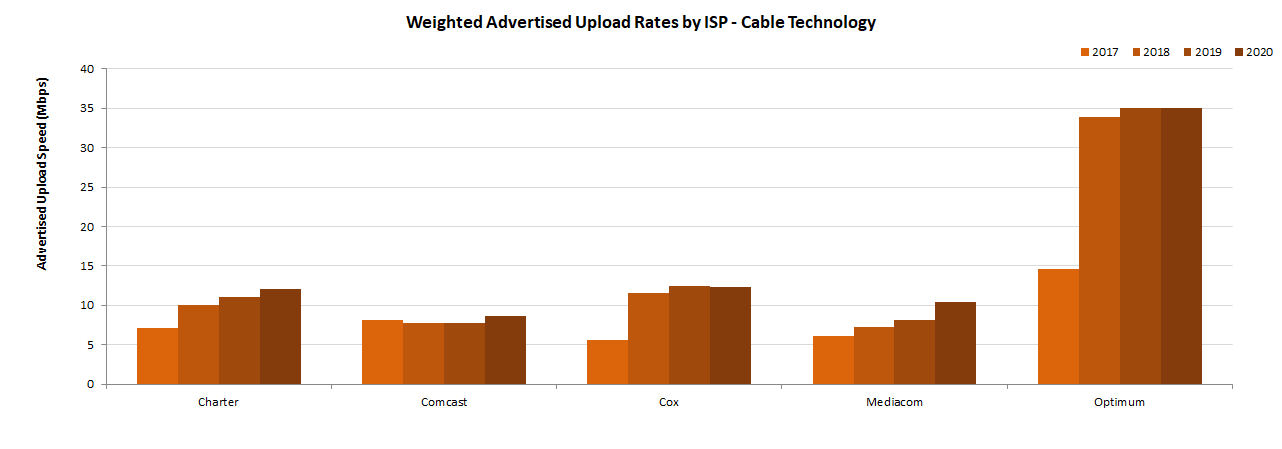
Chart 11 compares the weighted average of the advertised upload speeds by technology for the last 4 years (September 2017 to September-October 2020) taken as a composite across all ISPs. The advertised upload speeds (419.6 Mbps) for fiber was far higher than for other technologies. Consequently, in order to see the trend in upload speeds of DSL and Cable technologies, the results for these technologies were segregated and are represented in the chart on a different scale than the upload speed for Fiber technology. As can be seen in this chart, all technologies showed increased rates in 2020 as compared to 2017. However, the rates of increase were not the same for all technologies. The rate of increase in the weighted average of Fiber technology was 524% compared to DSL and Cable which were 189% and 55%, respectively. Compared to the previous year’s (2019) results, 2020’s results reflected an increase of offered upload speeds for DSL of 160% to 3.9 Mbps and an increase in cable of 8% to 12 Mbps. However, the largest increase in 2020 was in Fiber upload speed, which was 419.6 Mbps, an increase of 116% from 2019.
Observing both the download and upload speeds, it is clear that fiber service tiers are generally symmetric in their actual upload and download speeds. This results from the fact that fiber technology has significantly more capacity than other technologies and can be engineered to have symmetric upload and download speeds. For other technologies with more limited capacity, higher capacity is usually allocated to download speeds than to upload speeds, typically in ratios ranging from 5:1 to 10:1.
B. Observed Median download and upload Speeds
Chart 4 (in Section 2.B) shows the ratio in September-October 2020 of the weighted median of both download and upload speeds of each ISP’s subscribers to advertised speeds. Charts 12.1 and 12.2 below show the same ratios separately for download speed and for upload speed. The median download speeds of most ISPs’ subscribers have been close to, or have exceeded, the advertised speeds. Exceptions to this were the following providers: CenturyLink, Cincinnati Bell DSL, and Cincinnati Bell Fiber with respective ratios of 96%, 78% and 90%.
Chart 12.1: The ratio of median download speed to advertised download speed.
 Chart 12.2 shows the median upload speed as a percentage of the advertised speed. As was the case with download speeds, most ISPs met or exceeded the advertised rates except for the following: CenturyLink, Cincinnati Bell DSL, Frontier DSL, Windstream, and Cox which had ratios, respectively, of 85%, 73%, 98%, 93% and 97%.
Chart 12.2: The ratio of median upload speed to advertised upload speed.
C. Variations In Speeds
Median speeds experienced by consumers may vary based on location and time of day as network architectures and traffic patterns may differ. Chart 5 in Section 2 above illustrates, for each ISP, the percentage of consumers (across the ISP’s service territory) who experienced a median download speed over the peak usage period that was either greater than 95%, between 80% and 95%, or less than 80% of the advertised download speed. Chart 13 below shows the corresponding percentage of consumers whose median upload speed fell in each of these ranges. The percentage of subscribers of ISPs using DSL technology experiencing speeds greater than or equal to 95% of their advertised upload speeds during peak hours was 0% to 44%; in contrast, 75% - 95% of subscribers of ISPs using cable or fiber technology experienced speeds equal to or better than 95% of their advertised upload speeds.
Chart 13: The percentage of consumers whose median upload speed was (a) greater than 95%, (b) between 80% and 95%, or (c) less than 80% of the advertised upload speed.
Though the median upload speeds experienced by most subscribers were close to or exceeded the advertised upload speeds, there were some subscribers, for each ISP, whose median upload speed fell significantly short of the advertised upload speed. This issue was most prevalent for ISPs using DSL technology. On the other hand, ISPs using cable and fiber technology generally showed consistency between median upload speed and advertised upload speed.
We can learn more about the variation in network performance by examining the complementary cumulative distribution statistics. For each ISP, we first calculate the ratio of the median download speed (over the peak usage period) to the advertised download speed for each panelist subscribing to that ISP. We then examine the distribution of this ratio across the set of panelists representing the ISP’s service territory.
Charts 14.1 and 14.2 show the complementary cumulative distribution of the ratio of median download speed (over the peak usage period) to advertised download speed for each participating ISP. For each ratio of measured to advertised download speed on the horizontal axis, the curves show the percentage of panelists, by ISP, who experienced at least this ratio.[33] For example, the curve in Chart 14.1 for Cincinnati Bell fiber shows that 90% of its subscribers experienced a median download speed exceeding 67% of the advertised download speed, 70% experienced a median download speed exceeding 73% of the advertised download speed, and 50% experienced a median download speed exceeding 100% of the advertised download speed.
Chart 14.1: Complementary cumulative distribution of the ratio of median download speed to advertised download speed.
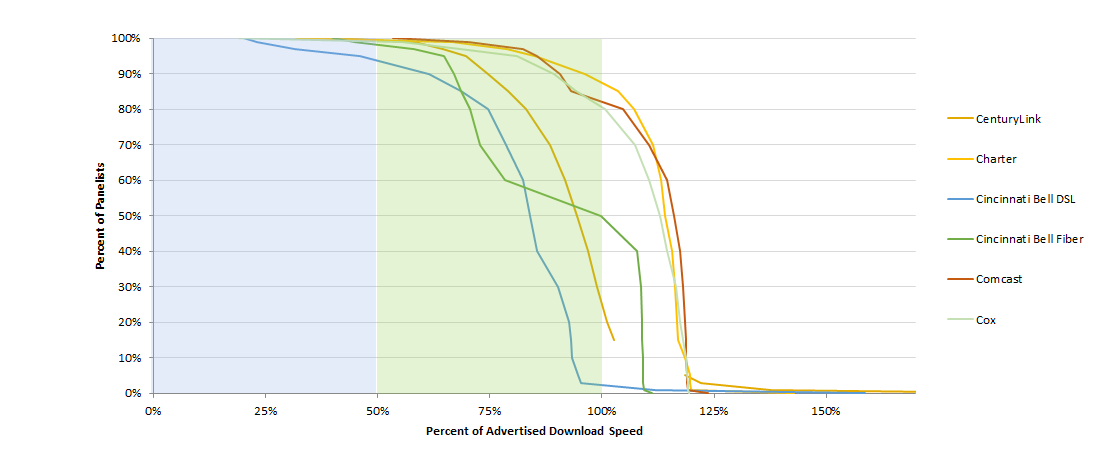
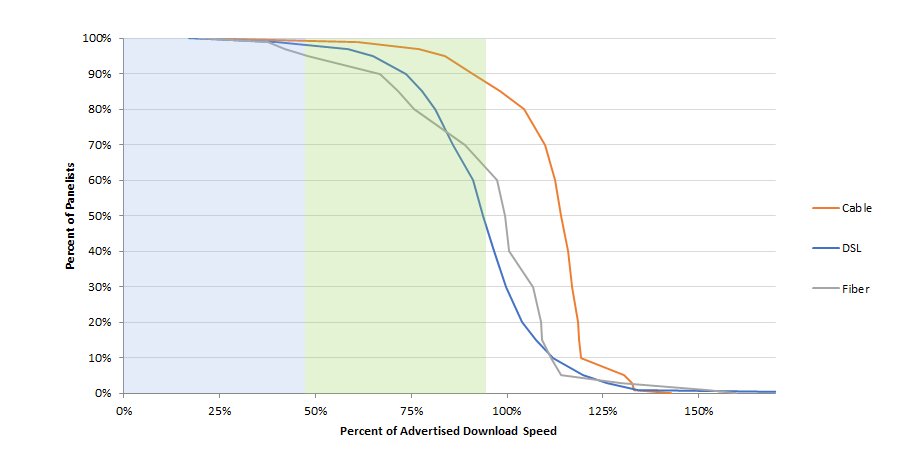
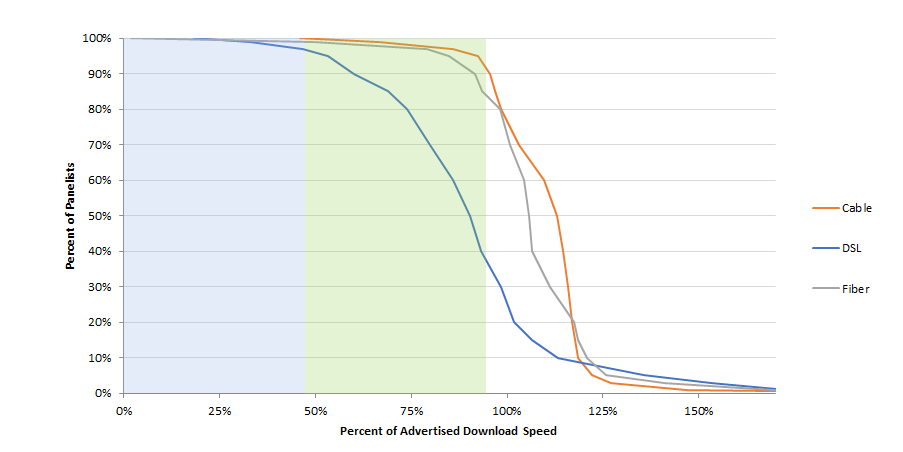
The curves for cable-based broadband and fiber-based broadband are steeper than those for DSL-based broadband. The speed achievable by DSL depends on the distance between the subscriber and the central office. Thus, the complementary cumulative distribution function will fall slowly unless the broadband ISP adjusts its advertised rate based on the subscriber’s location. Additionally, ISPs using DSL technology show curves that drop off at much less than 100% of advertised speed as compared to fiber and cable technologies. This can be seen more clearly in Chart 14.3, which plots aggregate curves for each technology. Approximately 90% of subscribers to cable and 50% of subscribers to fiber-based technologies experience median download speeds exceeding the advertised download speed. In contrast, less than 30% of subscribers to DSL-based services experience median download speeds exceeding the advertised download speed.[34]
Chart 14.3: Complementary cumulative distribution of the ratio of median download speed to advertised download speed, by technology.
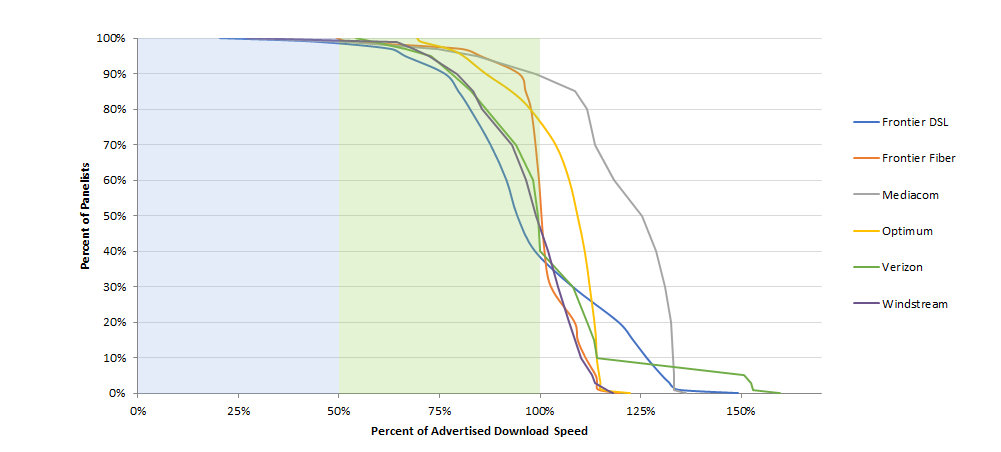
Charts 14.4 to 14.6 show the complementary cumulative distribution of the ratio of median upload speed (over the peak usage period) to advertised upload speed for each participating ISP (Charts 14.4 and 14.5) and by access technology (Chart 14.6).
Chart 14.4: Complementary cumulative distribution of the ratio of median upload speed to advertised upload speed.
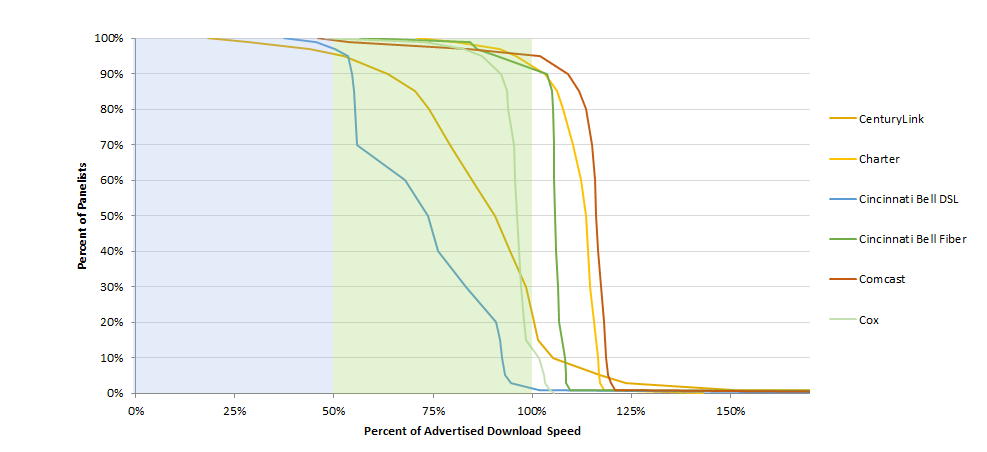
Chart 14.5: Complementary cumulative distribution of the ratio of median upload speed to advertised upload speed (continued).
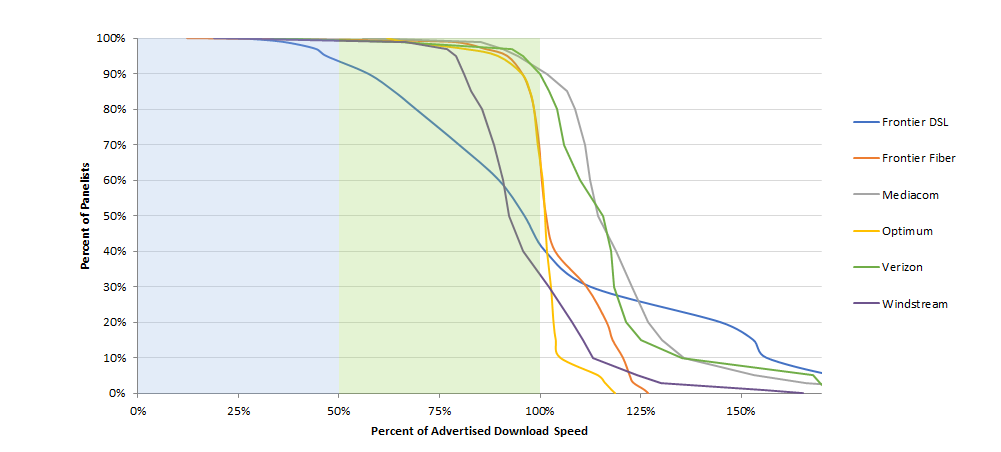
Chart 14.6: Complementary cumulative distribution of the ratio of median upload speed to advertised upload speed, by technology.
All speeds discussed above were measured during peak usage periods. In contrast, Charts 15.1 and 15.2 below compare the ratio of actual download and upload speeds to advertised download and upload speeds during peak and off-peak times. Charts 15.1 and 15.2 show that most ISP subscribers experience only a slight degradation from off-peak to peak hour performance.
Chart 15.1: The ratio of weighted median download speed to advertised download speed, peak hours versus off-peak hours.
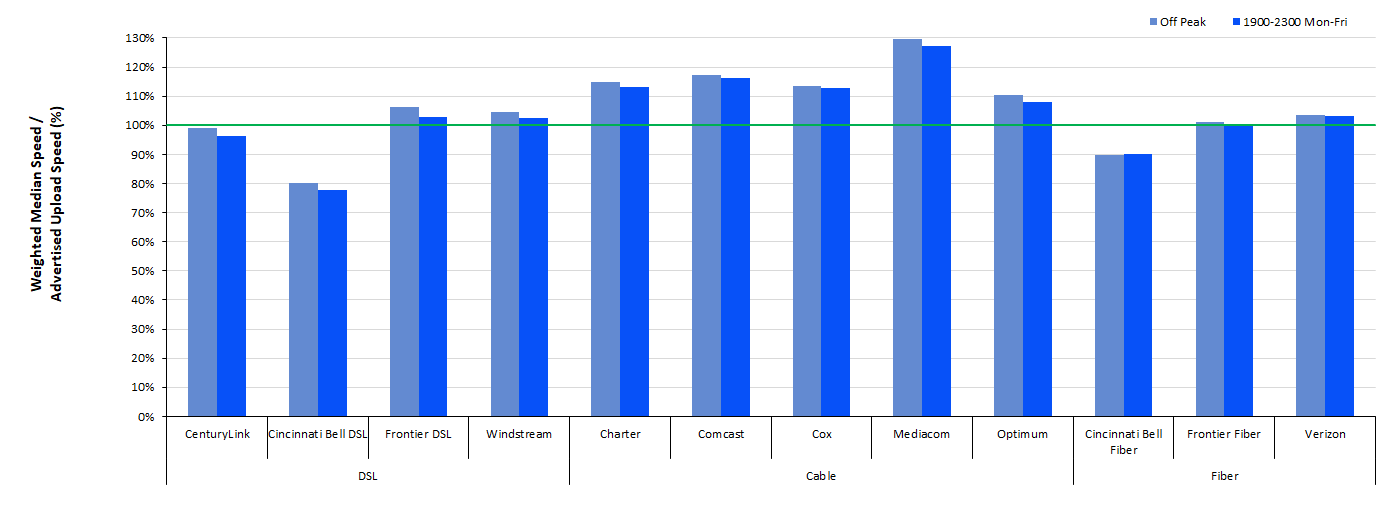
Chart 15.2: The ratio of weighted median upload speed to advertised upload speed, peak versus off-peak.
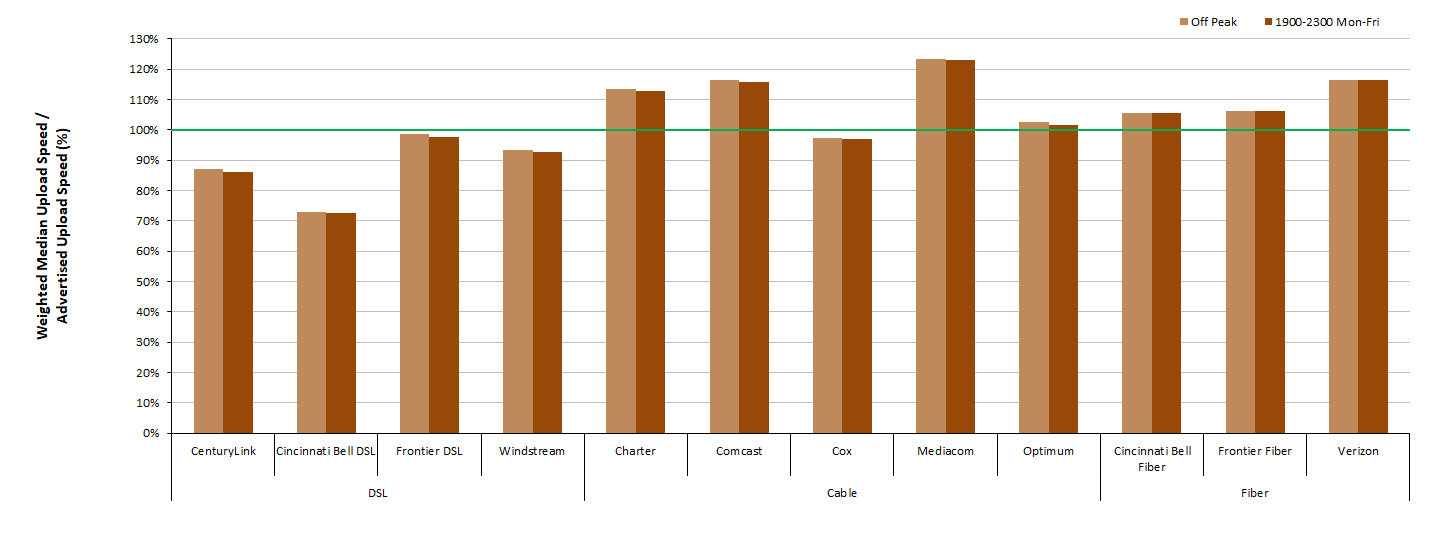
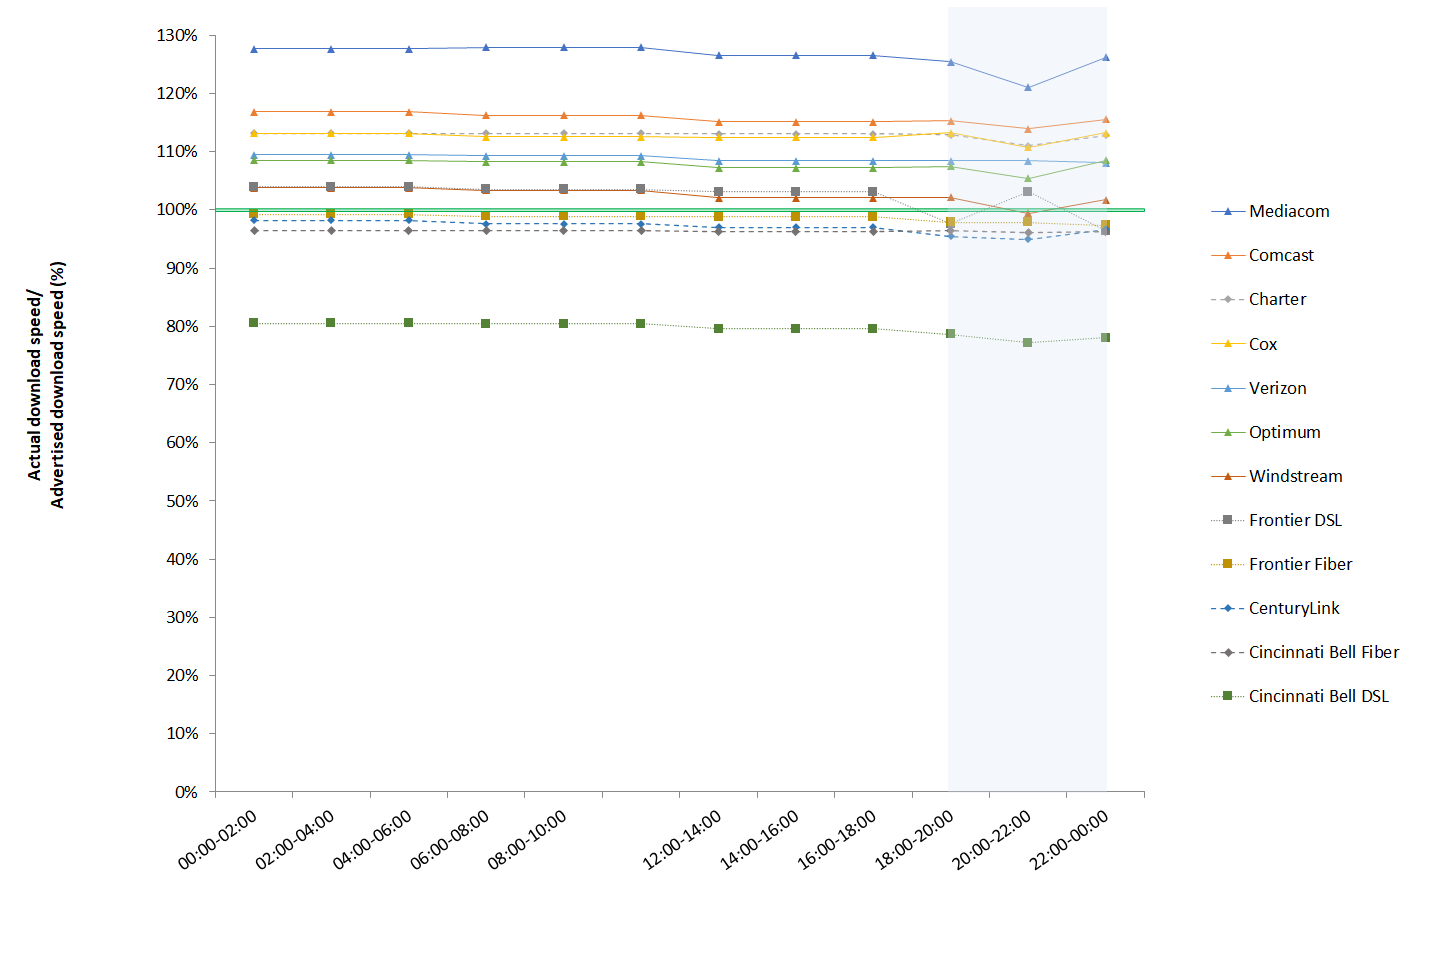
Chart 16 below shows the actual download speed to advertised speed ratio in each two-hour time block during weekdays for each ISP. The ratio is lowest during the busiest four-hour time block (7:00 p.m. to 11:00 p.m.).
Chart 16: The ratio of median download speed to advertised download speed, Monday-to-Friday, two-hour time blocks, terrestrial ISPs.
For each ISP, Chart 6 (in Section 2.C) showed the ratio of the 80/80 consistent median download speed to advertised download speed, and for comparison, Chart 4 showed the ratio of median download speed to advertised download speed.
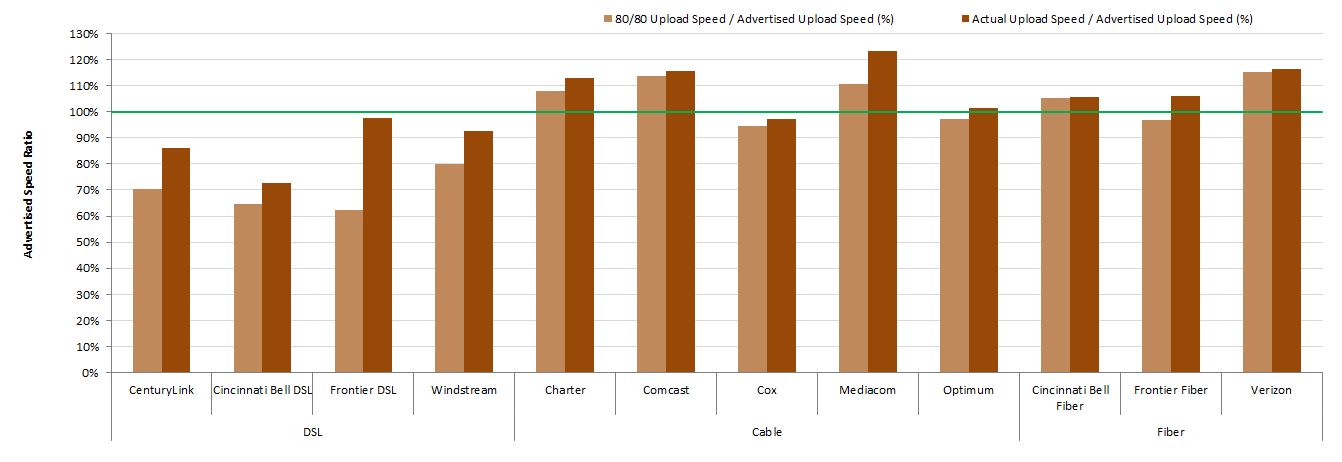
Chart 17.1 illustrates information concerning 80/80 consistent upload speeds. While all the upload 80/80 speeds were slightly lower than the median speed, the differences were more marked in DSL. Charts 6 and 17.1 reflect that cable and fiber technologies behaved more consistently than DSL technology both for download as well as upload speeds.
Chart 17.1: The ratio of 80/80 consistent upload speed to advertised upload speed.
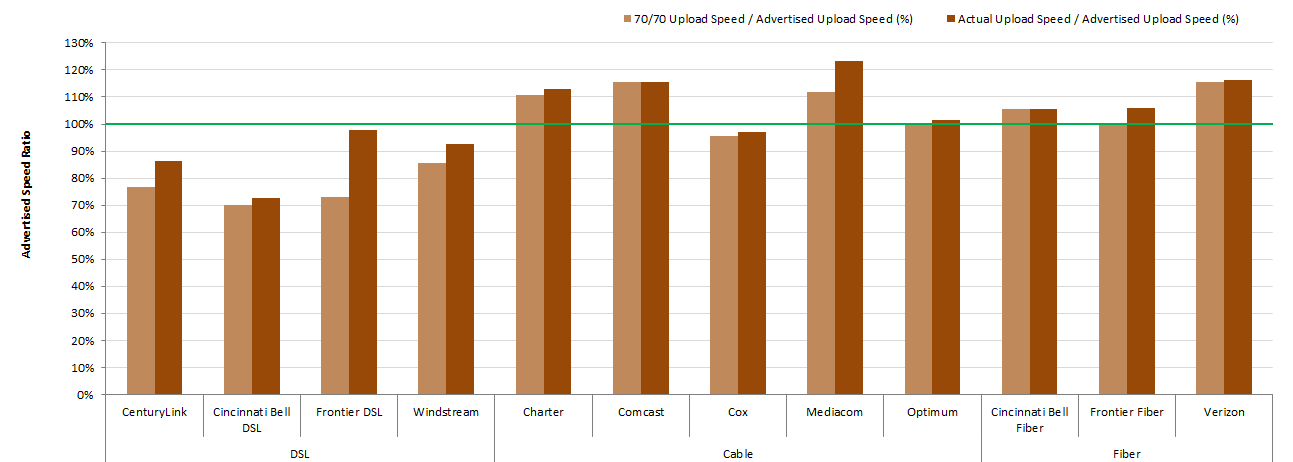
Charts 17.2 and 17.3 below illustrate similar consistency metrics for 70/70 consistent download and upload speeds, i.e., the minimum download or upload speed (as a percentage of the advertised download or upload speed) experienced by at least 70% of panelists during at least 70% of the peak usage period. The ratios for 70/70 consistent speeds as a percentage of the advertised speed are higher than the corresponding ratios for 80/80 consistent speeds. In fact, for many ISPs, the 70/70 consistent download or upload speed is close to the median download or upload speed. Once again, ISPs using DSL technology showed a considerably smaller value for the 70/70 download and upload speeds as compared to the download and upload median speeds, respectively.
Chart 17.2: The ratio of 70/70 consistent download speed to advertised download speed.
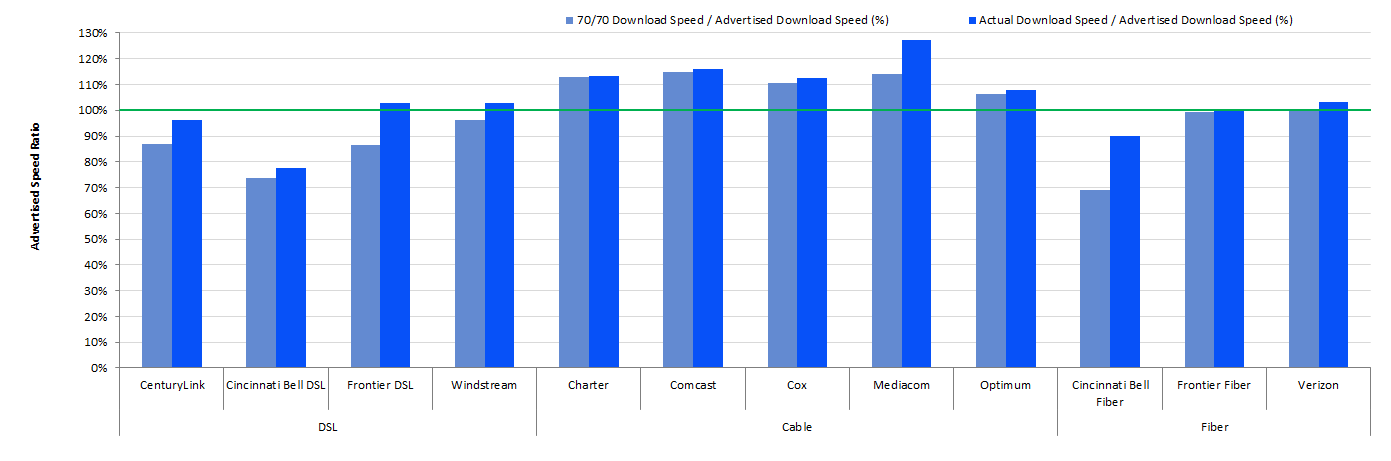
Chart 17.3: The ratio of 70/70 consistent upload speed to advertised upload speed.
D. Latency
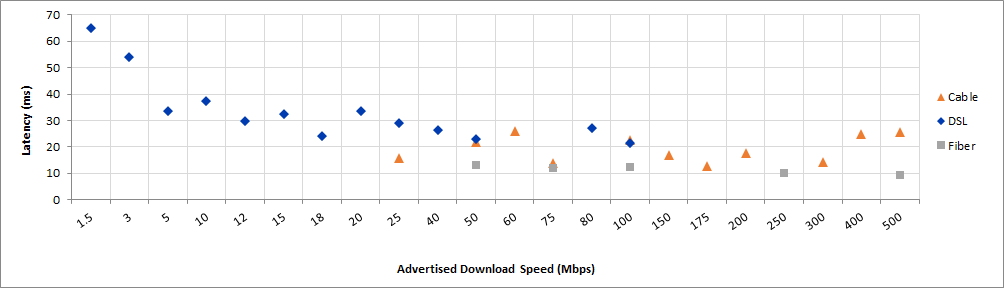
Chart 18 below shows the weighted median latencies, by technology and by advertised download speed, for terrestrial technologies. For all terrestrial technologies, latency varied little with advertised download speed. DSL service typically had higher latencies, and lower latency for DSL correlated more closely to achieving advertised download speed, compared to lower latency correlation to advertised download speed for either cable or fiber. Cable latencies ranged between 13 ms to 26 ms, fiber latencies between 9 ms to 13 ms, and DSL between 21 ms to 65 ms.
Chart 18: Latency for Terrestrial ISPs, by technology, and by advertised download speed.
5. AdditionalTest Results
A. Actual Speed, By Service Tier
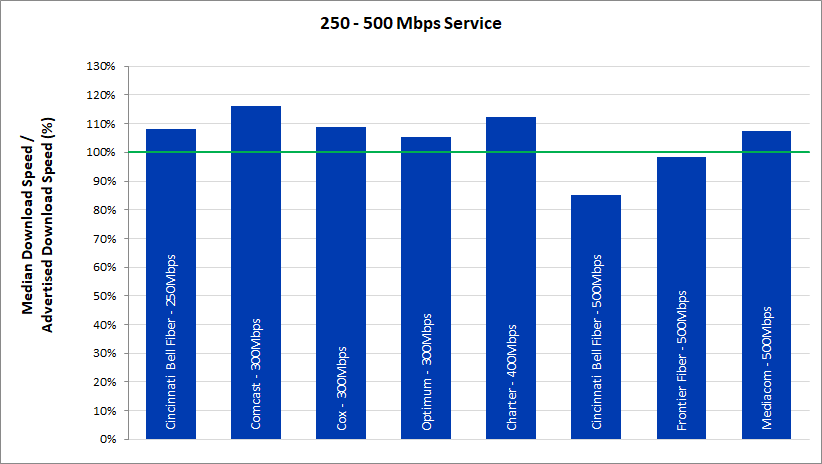
As shown in Charts 19.1-19.7, peak usage period performance varied by service tier among participating ISPs during the September-October 2020 period. On average, during peak periods, the ratio of median download speed to advertised download speed formost ISPs was 90% or better, with all ISPs achieving a ratio of 73% or better. The ratio of median download speed to advertised download speed, however, varied among service tiers. Out of the 44 speed tiers that were measured in total across the participating ISPs, 40 showed achievement of at least 90% of the advertised speed, and advertised speed was met or exceeded in 31 of the 44 tiers.
Chart 19.1: The ratio of median download speed to advertised download speed, by ISP (1.5-10 Mbps).
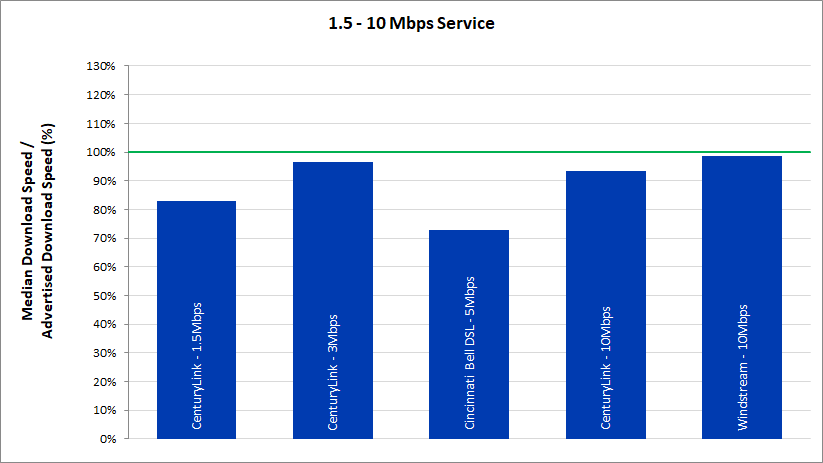
Chart 19.2: The ratio of median download speed to advertised download speed, by ISP (12-18 Mbps).
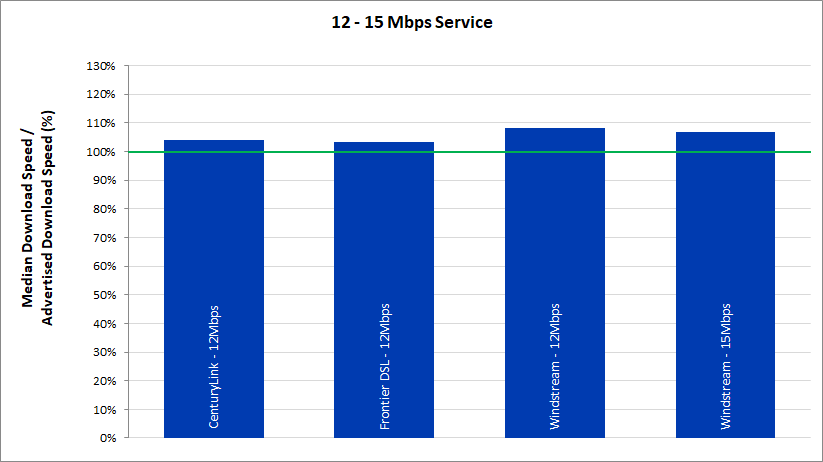
Chart 19.3: The ratio of median download speed to advertised download speed, by ISP (18-25 Mbps).
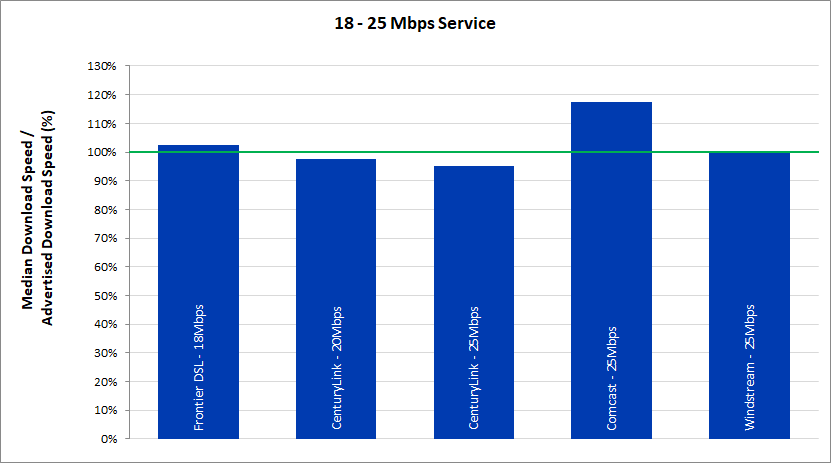
Chart 19.4: The ratio of median download speed to advertised download speed, by ISP (40-75 Mbps).
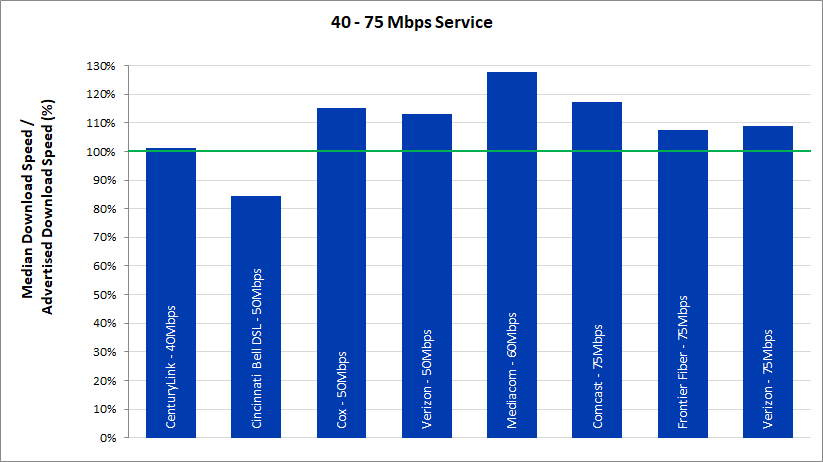
Chart 19.5: The ratio of median download speed to advertised download speed, by ISP (80-100Mbps).
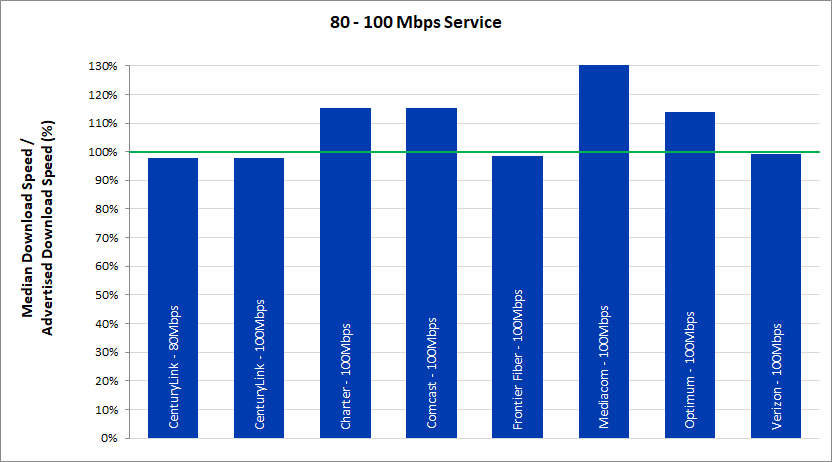
Chart 19.6: The ratio of median download speed to advertised download speed, by ISP (150-200 Mbps).
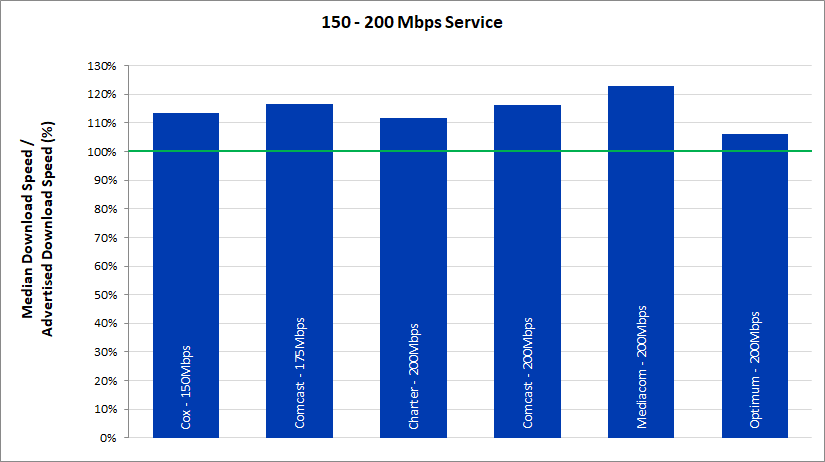
Chart 19.7: The ratio of median download speed to advertised download speed, by ISP (250-500 Mbps).
Charts 20.1 – 20.5 depict the ratio of median upload speeds to advertised upload speeds for each ISP by service tier. Out of the 29 upload speed tiers that were measured across the participating ISPs, 25 reflected achievement of at least 90% of the advertised upload speed, and advertised speed was met or exceeded in 18 of the 29 tiers.
Chart 20.1: The ratio of median upload speed to advertised upload speed, by ISP (0.512 - 1 Mbps).
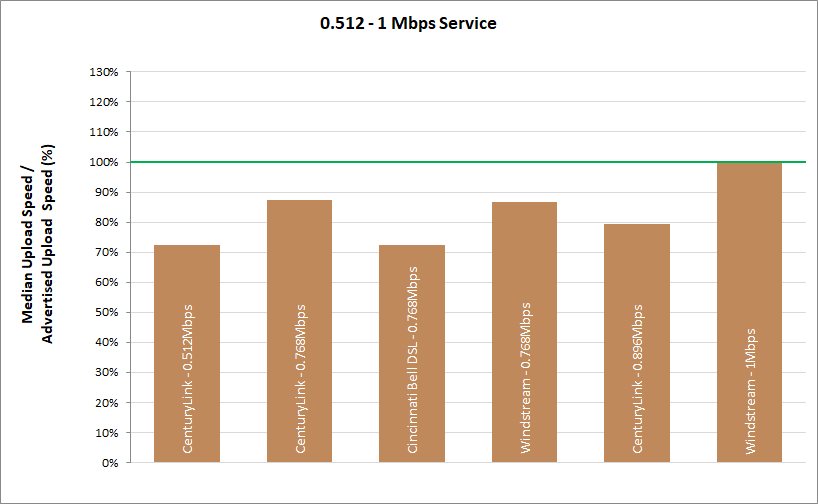
Chart 20.2: The ratio of median upload speed to advertised upload speed, by ISP (1.5-5 Mbps).
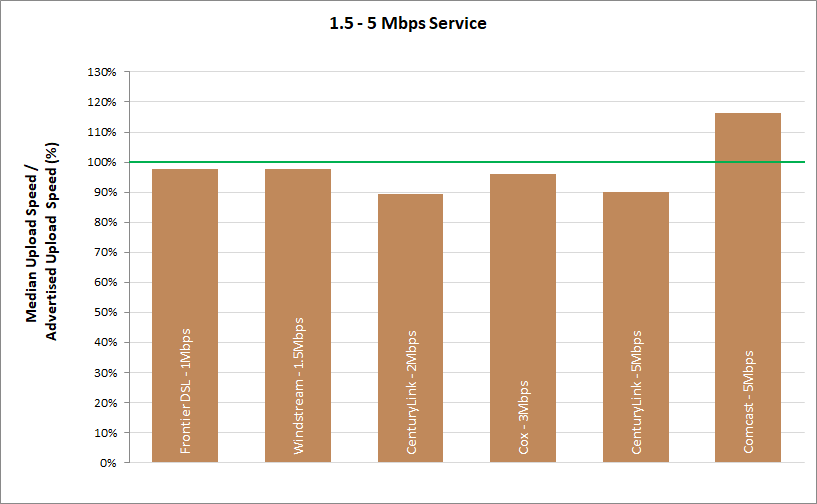
Chart 20.3: The ratio of median upload speed to advertised upload speed, by ISP (10 -20 Mbps).
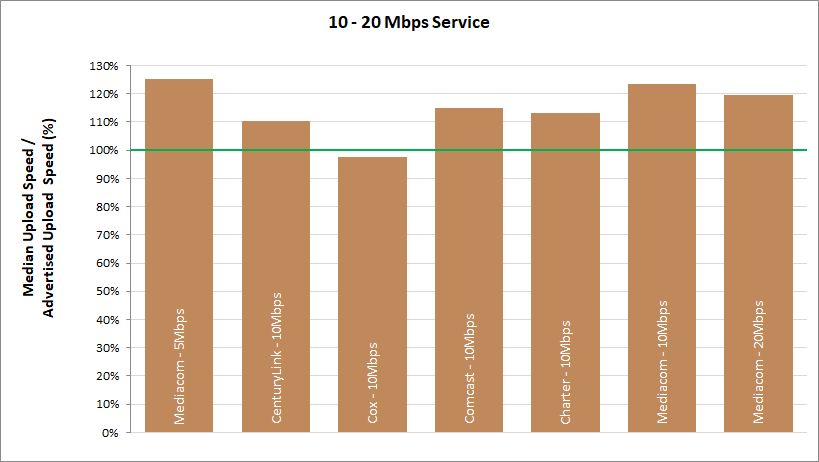
Chart 20.4: The ratio of median upload speed to advertised upload speed, by ISP (30-75 Mbps).
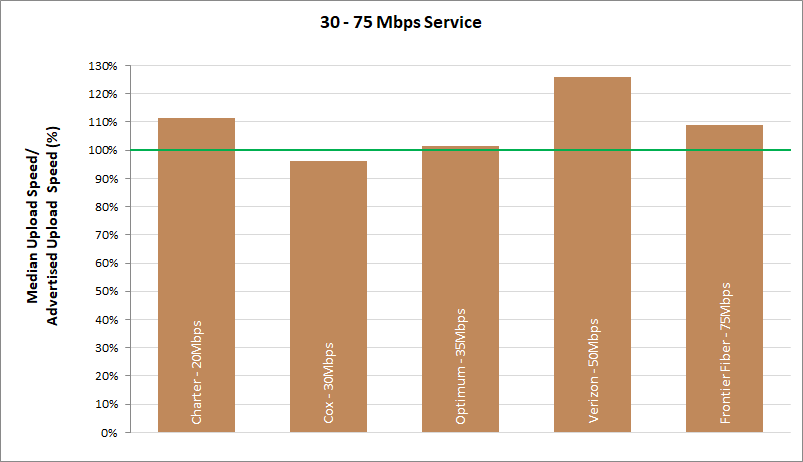
Chart 20.5: The ratio of median upload speed to advertised upload speed, by ISP (100–200 Mbps).
Table 2 lists the advertised download service tiers included in this study. For each tier, an ISP’s advertised download speed is compared with the median of the measured download speed results. As we noted in the past reports, the download speeds listed here are based on national averages and may not represent the performance experienced by any particular consumer at any given time or place.
Table 2: Peak period median download speed, sorted by actual download speed
|
ISP |
Advertised Download Speed (Mbps) |
Download Median Speed (Mbps) |
Actual Speed /Advertised Speed (%) |
|
CenturyLink |
1.5 |
1.24 |
82.84% |
|
CenturyLink |
3 |
2.90 |
96.70% |
|
Cincinnati Bell DSL |
5 |
3.64 |
72.70% |
|
CenturyLink |
10 |
9.35 |
93.49% |
|
Windstream |
10 |
9.87 |
98.68% |
|
CenturyLink |
12 |
12.49 |
104.08% |
|
Frontier DSL |
12 |
12.39 |
103.22% |
|
Windstream |
12 |
12.97 |
108.07% |
|
Windstream |
15 |
16.04 |
106.96% |
|
Frontier DSL |
18 |
18.45 |
102.48% |
|
CenturyLink |
20 |
19.48 |
97.41% |
|
CenturyLink |
25 |
23.77 |
95.08% |
|
Comcast |
25 |
29.33 |
117.30% |
|
Windstream |
25 |
25.11 |
100.45% |
|
CenturyLink |
40 |
40.46 |
101.14% |
|
Cincinnati Bell DSL |
50 |
42.13 |
84.26% |
|
Cox |
50 |
57.54 |
115.07% |
|
Verizon |
50 |
56.56 |
113.11% |
|
Mediacom |
60 |
76.68 |
127.81% |
|
Comcast |
75 |
88.02 |
117.35% |
|
Frontier Fiber |
75 |
80.54 |
107.38% |
|
Verizon |
75 |
81.75 |
109.01% |
|
CenturyLink |
80 |
78.29 |
97.87% |
|
CenturyLink |
100 |
97.64 |
97.64% |
|
Charter |
100 |
115.07 |
115.07% |
|
Comcast |
100 |
115.12 |
115.12% |
|
Frontier Fiber |
100 |
98.46 |
98.46% |
|
Mediacom |
100 |
131.04 |
131.04% |
|
Optimum |
100 |
113.73 |
113.73% |
|
Verizon |
100 |
99.33 |
99.33% |
|
Cox |
150 |
169.91 |
113.27% |
|
Comcast |
175 |
204.26 |
116.72% |
|
Charter |
200 |
223.07 |
111.53% |
|
Comcast |
200 |
232.45 |
116.23% |
|
Mediacom |
200 |
245.41 |
122.70% |
|
Optimum |
200 |
212.44 |
106.22% |
|
Cincinnati Bell Fiber |
250 |
269.93 |
107.97% |
|
Comcast |
300 |
348.51 |
116.17% |
|
Cox |
300 |
326.41 |
108.80% |
|
Optimum |
300 |
315.74 |
105.25% |
|
Charter |
400 |
449.20 |
112.30% |
|
Cincinnati Bell Fiber |
500 |
425.02 |
85.00% |
|
Frontier Fiber |
500 |
492.35 |
98.47% |
|
Mediacom |
500 |
536.97 |
107.39% |
B. Variations In Speed
In Section 3.C above, we present speed consistency metrics for each ISP based on test results averaged across all service tiers. In this section, we provide detailed speed consistency results for each ISP’s individual service tiers. Consistency of speed is important for services such as video streaming, for which a significant reduction in speed for more than a few seconds can force a reduction in video resolution or an intermittent loss of service.
Charts 21.1 – 21.3 below show the percentage of consumers that achieved greater than 95%, between 85% and 95%, or less than 80% of the advertised download speed for each ISP speed tier. ISPs typically quote a single ‘up-to’ speed as advertised download speed. This single ‘up-to’ speed, in the case of DSL subscribers, does not take into account that the actual speed of DSL depends on the distance between the subscriber and the serving central office. Thus, as has been observed in past MBA reports, ISPs using DSL technology frequently fail to deliver the advertised service. Fiber and Cable companies, in general, showed a high consistency of speed.
Similarly, Charts 22.1 to 22.3 show the percentage of consumers that achieved greater than 95%, between 85% and 95%, or less than 80% of the advertised upload speed for each ISP speed tier.
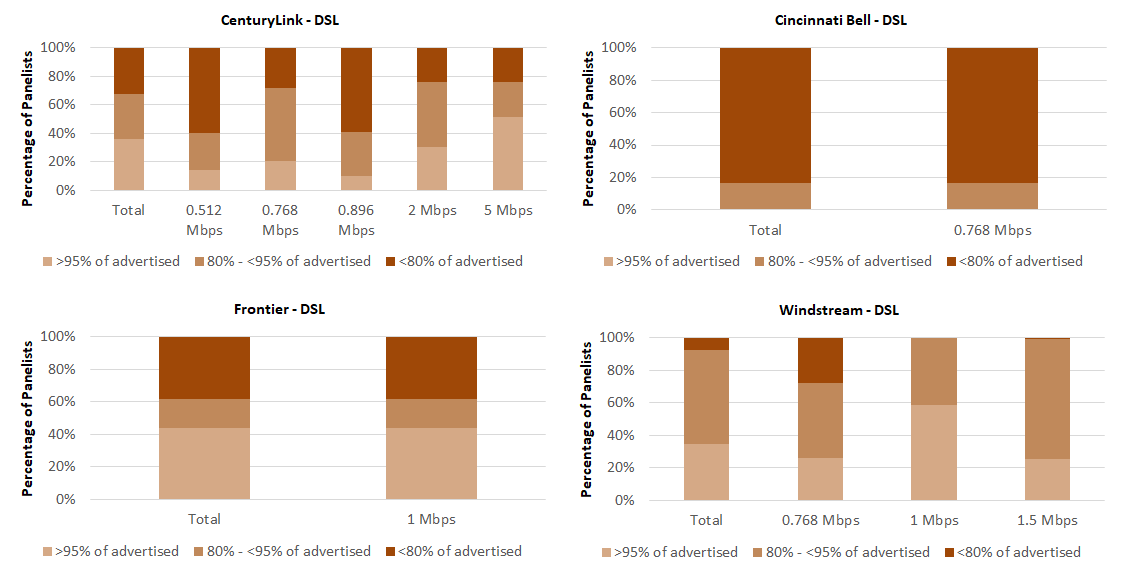
Chart 22.2: The percentage of consumers whose median upload speed was greater than 95%, between 80% and 95%, or less than 80% of the advertised upload speed (cable).
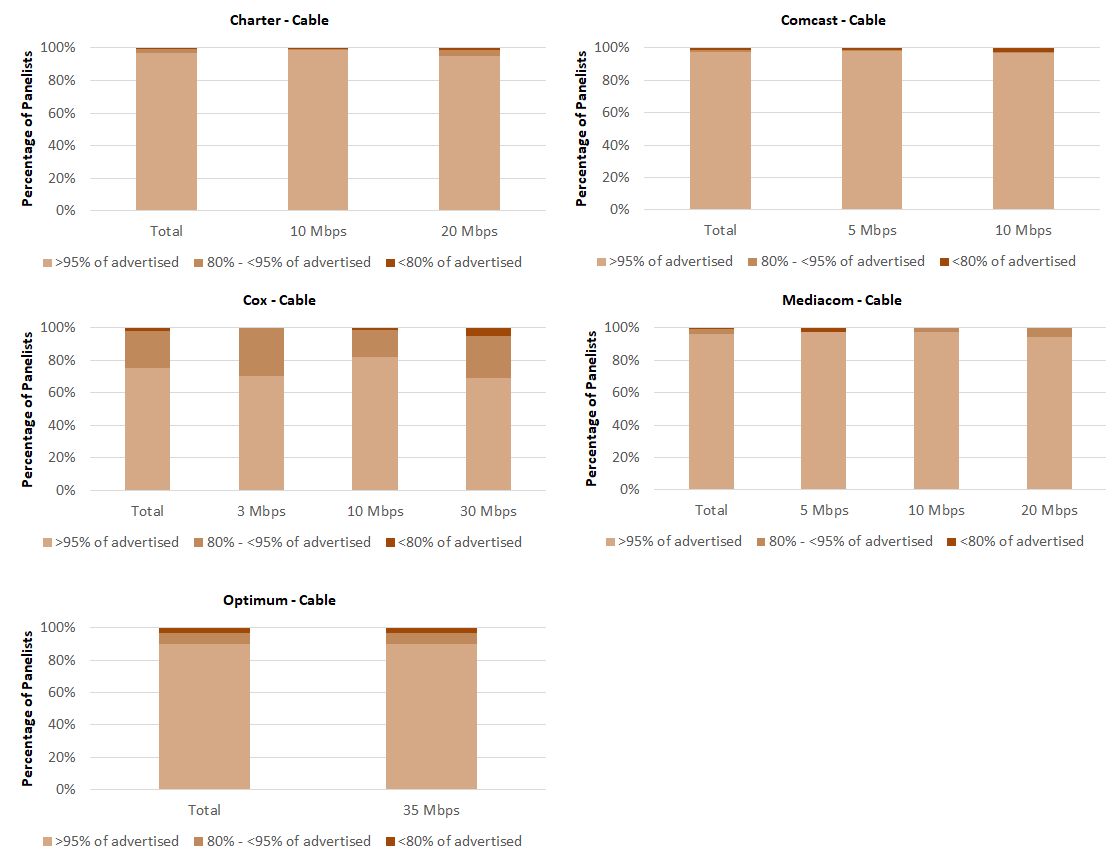
Chart 22.3: The percentage of consumers whose median upload speed was greater than 95%, between 80% and 95%, or less than 80% of the advertised upload speed (fiber).
In Section 3.C above, we present complementary cumulative distributions for each ISP based on test results across all service tiers. Below, we provide tables showing selected points on these distributions by each individual ISP. In general, DSL technology showed performance between 0% and 44% of advertised speed for at least 95% of their subscribers. Among cable-based companies, the average download speeds experienced by at least 95% of subscribers were between 75% and 98% of advertised rates. Fiber-based services provided a range from 93% to 99% of advertised download speeds for at least 95% of subscribers.
Table 3: Complementary cumulative distribution of the ratio ofmedian download speed to advertised download speed by ISP.
|
ISP |
20% |
50% |
70% |
80% |
90% |
95% |
|
CenturyLink |
101.1% |
94.5% |
88.4% |
83.0% |
74.6% |
69.8% |
|
Charter |
116.8% |
114.1% |
111.4% |
107.1% |
96.2% |
85.0% |
|
Cincinnati Bell Fiber |
92.6% |
83.9% |
78.7% |
74.0% |
61.5% |
46.0% |
|
Cincinnati Bell DSL |
108.9% |
99.8% |
72.7% |
70.6% |
67.0% |
64.7% |
|
Comcast |
118.6% |
116.1% |
110.6% |
104.6% |
90.7% |
85.5% |
|
Cox |
117.5% |
113.0% |
107.5% |
100.6% |
89.2% |
81.0% |
|
Frontier DSL |
119.5% |
94.3% |
87.7% |
82.6% |
76.3% |
66.3% |
|
Frontier Fiber |
108.6% |
100.3% |
98.9% |
97.7% |
94.7% |
85.0% |
|
Mediacom |
132.5% |
125.3% |
113.7% |
111.6% |
98.9% |
84.4% |
|
Optimum |
113.5% |
109.3% |
103.9% |
97.6% |
86.5% |
81.0% |
|
Verizon Fiber |
111.7% |
99.4% |
94.0% |
86.5% |
78.0% |
72.8% |
|
Windstream |
107.2% |
99.0% |
93.1% |
85.6% |
79.4% |
72.5% |
Table 4: Complementary cumulative distribution of the ratio ofmedian upload speed to advertised upload speed by ISP.
|
ISP |
20% |
50% |
70% |
80% |
90% |
95% |
|
CenturyLink |
100.4% |
90.5% |
79.3% |
74.1% |
63.6% |
52.5% |
|
Charter |
115.7% |
113.6% |
110.3% |
107.8% |
103.2% |
96.0% |
|
Cincinnati Bell Fiber |
90.9% |
73.6% |
55.8% |
55.3% |
54.6% |
53.5% |
|
Cincinnati Bell DSL |
106.9% |
105.7% |
105.5% |
105.1% |
103.8% |
91.1% |
|
Comcast |
118.1% |
116.2% |
115.2% |
113.7% |
109.1% |
101.9% |
|
Cox |
97.8% |
96.1% |
95.4% |
94.0% |
92.1% |
87.2% |
|
Frontier DSL |
144.7% |
96.0% |
79.7% |
69.0% |
57.1% |
46.7% |
|
Frontier Fiber |
116.6% |
101.6% |
98.8% |
98.6% |
95.6% |
91.9% |
|
Mediacom |
126.9% |
114.4% |
111.1% |
108.7% |
101.7% |
94.5% |
|
Optimum |
103.3% |
101.2% |
99.3% |
98.4% |
95.4% |
89.4% |
|
Verizon Fiber |
121.3% |
115.7% |
105.9% |
104.3% |
100.1% |
95.8% |
|
Windstream |
108.1% |
92.3% |
88.5% |
85.7% |
81.2% |
79.1% |
C. Web Browsing Performance, By Service Tier
Below, we provide the detailed results of the webpage download time for each individual service tier of each ISP. Generally, website loading time decreased steadily with increasing tier speed until a tier speed of 25 Mbps and does not change markedly above that speed.
Chart 23.1: Average webpage download time, by ISP (1.5-10 Mbps).
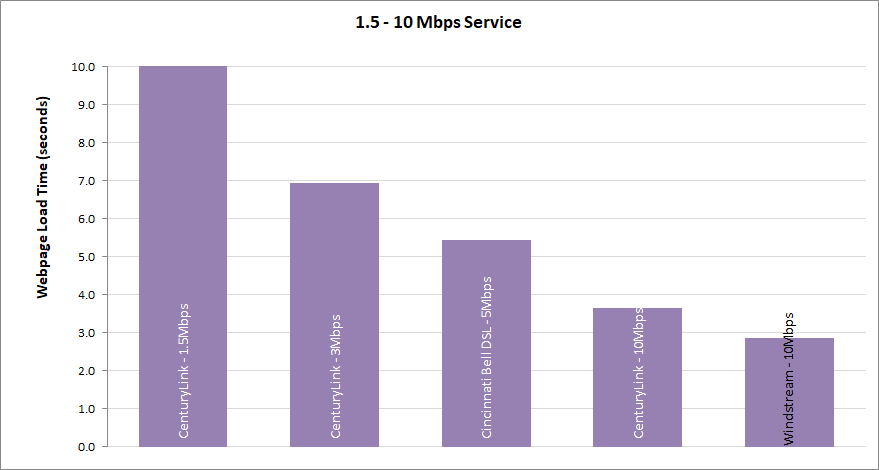
Chart 23.2: Average webpage download time, by ISP (12-15 Mbps).
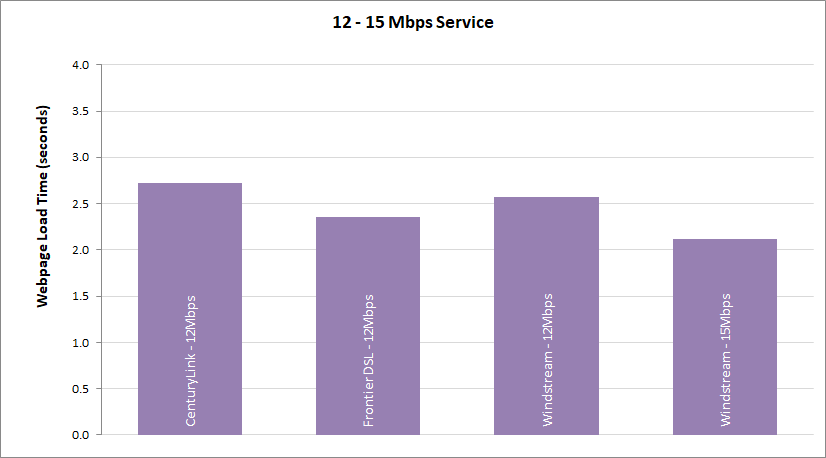
Chart 23.3: Average webpage download time, by ISP (18-25 Mbps).
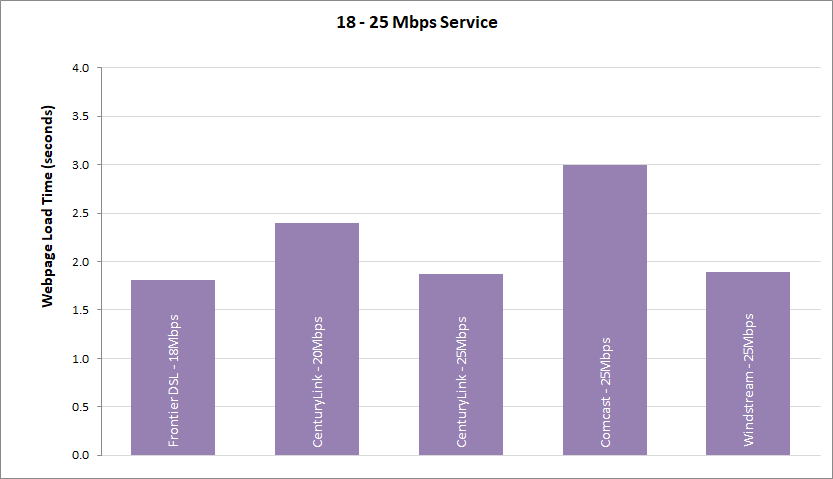
Chart 23.4: Average webpage download time, by ISP (40-75 Mbps).
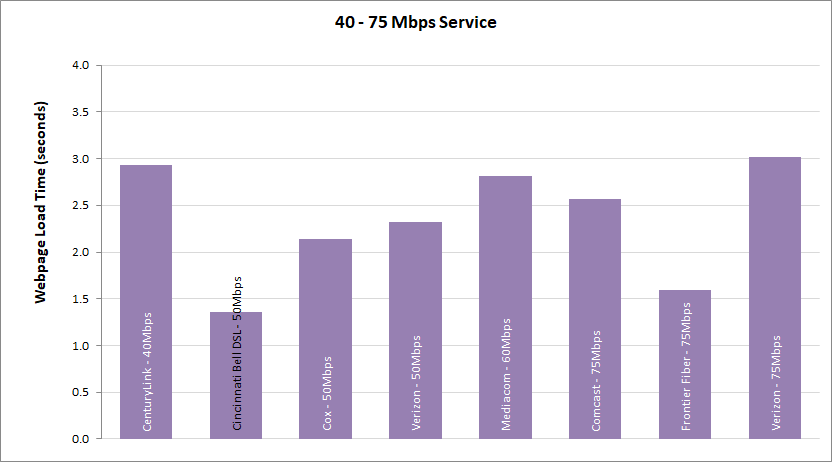
Chart 23.5: Average webpage download time, by ISP (80 - 100 Mbps).
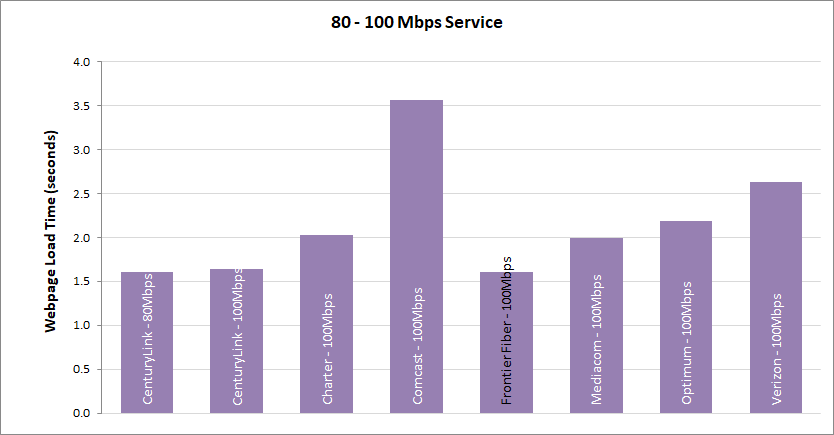
Chart 23.6: Average webpage download time, by ISP (150 - 200 Mbps).
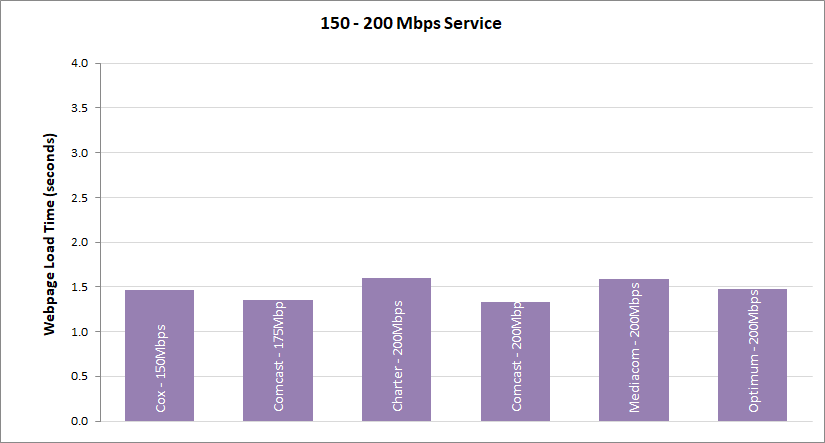
Chart 23.7: Average webpage download time, by ISP (250 - 500 Mbps).
Annex: MBA Performance During COVID-19 Pandemic
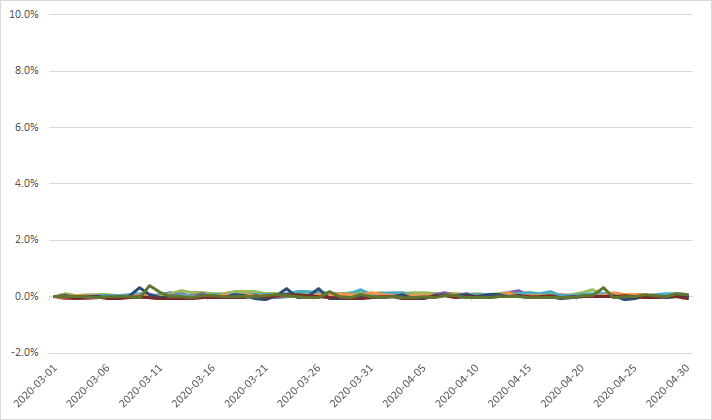
The year 2020 marked the spread of the Covid-19 pandemic not only within the USA but across much of the globe. Using the pre-pandemic date of March 1 as a benchmark, the key performance measures of download speed, upload speed, latency and packet loss were monitored until the end of April.
Chart A.1 below shows the download speed performance for each ISP averaged across all tiers and across all times during each day as compared (in percentage) with the same averages for each ISP on March 1 (i.e., before pandemic). It should be noted that ISP names have been anonymized in these charts with the aim being to show general trends.
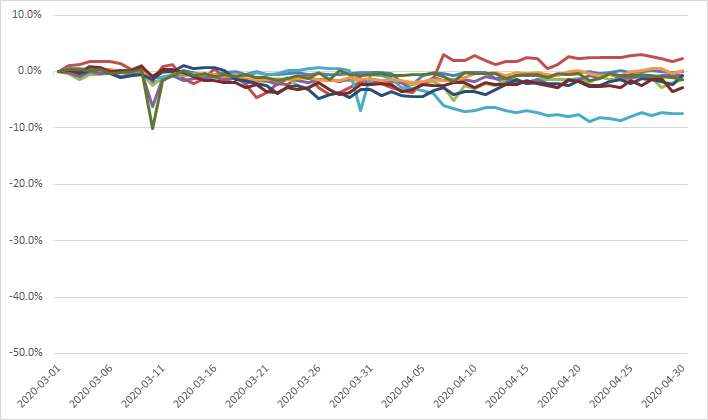
As can be seen from Chart A.1, most ISPs (with the exception of one) showed between 2% to 4% lower results during the pandemic period as compared to the pre-pandemic period. The one outlier, on March 10th, showed a 2%-10% deterioration. The strong blip in this chart on that date likely is attributed to the congestion caused by large downloads of an 86-Gigabyte game update (Call of Duty Warzone) that was released that day. As can be seen, most ISPs quickly recovered from the deterioration in their download speed performance.
Chart A.2 shows the upload speed performance for each ISP averaged across all tiers and across all times during each day providing the percentage change with same averages for each ISP on March 1. Compared to download speeds, the upload speeds showed somewhat less deterioration during the pandemic, with all ISPs performing within ± 3% of the March 1 average.
The one parameter that did show general degradation during the pandemic was latency as seen in Chart A.3 which shows a general deterioration in latency during the pandemic period by up to 10% for a few ISPs.
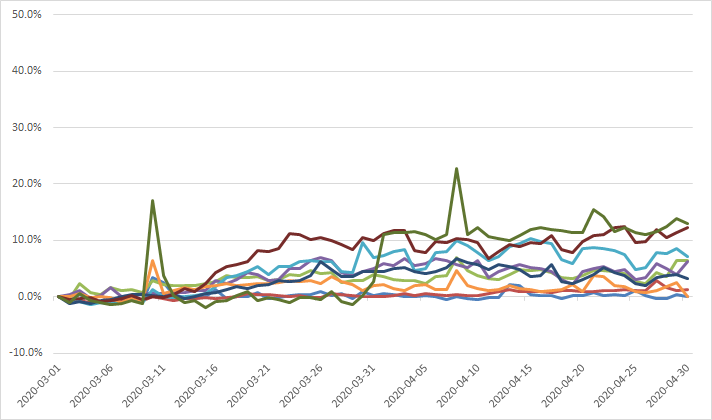
Chart A.4 depicts the average packet loss performance on dates between March 1 to April 30 as a percentage of the average packet loss value on March 1 for the same set of whiteboxes. As can be seen from Chart A4, there was no noticeable change in the average packet loss before (March 1) and during the pandemic period from mid-March to April 30, 2021.
[1] The actual dates used for measurements for this Eleventh Report were September 2 –24, 2020 (inclusive) plus September 26 - October 2, 2020 (inclusive). An isolated server outage forced the exclusion of data on September 25 to avoid anomalous results.
[2] The sample is representative in that it aims to include those tiers that constitute the top 80% of the subscriber base per ISP. Some tiers accordingly are not included. As with any sample, budget and sample constitution constraints limit completeness of coverage.
[3] All reports can be found at https://www.fcc.gov/general/measuring-broadband-america.
[4] The First Report (2011) was based on measurements taken in March 2011, the Second Report (2012) on measurements taken in April 2012, and the Third (2013) through Ninth (2019) Reports on measurements taken in September of the year prior to the reports’ release dates. In order to avoid confusion between the date of release of the report and the measurement dates, we have shifted last year to numbering the reports. Thus, this year’s report is termed the Eleventh MBA Report instead of the 2021 MBA Report. Going forward we will continue with a numbered approach and the next report will be termed as the Twelfth Report.
[7] We first determine the mean value over all the measurements for each individual panelist’s “whitebox.” (Panelists are sent “whiteboxes” that run pre-installed software on off-the-shelf routers that measure thirteen broadband performance metrics, including download speed, upload speed, and latency.) Then for each ISP’s speed tiers, we choose the median of the set of mean values for all the panelists/whiteboxes. The median is that value separating the top half of values in a sample set with the lower half of values in that set; it can be thought of as the middle (i.e., most typical) value in an ordered list of values. For calculations involving multiple speed tiers, we compute the weighted average of the medians for each tier. The weightings are based on the relative subscriber numbers for the individual tiers.
[8] Only tiers that contribute to the top 80% of an ISPs total subscribership are included in this report.
[9] It should be noted that the Form 477 subscriber data values generally lag the reporting month, and therefore, there are likely to be small inaccuracies in the tier ratios. It is for this reason that we encourage ISPs to provide us with subscriber numbers for the measurement month. The ISPs that provided SamKnows, the FCC’s contractor supporting the MBA program, with weights for each of their tiers were: Cincinnati Bell, CenturyLink, Charter, Comcast, Cox, Frontier, Optimum, Verizon and Windstream.
[10] For an explanation of Form 477 filing requirements and required data see:https://transition.fcc.gov/form477/477inst.pdf (Last accessed 9/02/2021).
[11] “It is important to track the changing mix of devices and connections and growth in multidevice ownership as it affects traffic patterns. Video devices, in particular, can have a multiplier effect on traffic. An Internet-enabled HD television that draws couple - three hours of content per day from the Internet would generate as much Internet traffic as an entire household today, on an average. Video effect of the devices on traffic is more pronounced because of the introduction of Ultra-High-Definition (UHD), or 4K, video streaming. This technology has such an effect because the bit rate for 4K video at about 15 to 18 Mbps is more than double the HD video bit rate and nine times more than Standard-Definition (SD) video bit rate. We estimate that by 2023, two-thirds (66 percent) of the installed flat-panel TV sets will be UHD, up from 33 percent in 2018” See Cisco Annual Internet Report (2018-2023) White Paper , https://www.cisco.com/c/en/us/solutions/collateral/executive-perspectives/annual-internet-report/white-paper-c11-741490.html (Last accessed Aug. 23, 2021).
[12] Please note that this average for September-October 2020 and September 2019 represents the average advertised download speed with AT&T tiers removed. We did this to allow a more accurate comparison between this year’s report and the preceding ones, since AT&T is no longer an active participant in the MBA program.
[13] Since AT&T is no longer actively participating in the Measuring Broadband America program, we have removed it from previous years’ results in Charts 1 and 2. This allows a more accurate comparison between the results for this year and previous years. It also should be noted that although AT&T IPBB had been characterized in previous reports as a DSL technology it actually included a mix of ADSL2+, VDSL2, G.Fast, and Ethernet technologies delivered over a hybrid of fiber optic and copper facilities.
[14] Note that this chart includes only those panelists who continued to report both in 2019 and 2020. Where several technologies are plotted at the same point in the chart, this is identified as “Multiple Technologies.”
[15] Of the 2472 panelists who participated in the September-October 2019 collection of data, 1196 panelists continued to participate in the September-October 2020 collection of data.
[16] We do not attempt here to distinguish between these two cases.
[17] These migrations may also be partly attributed to ISPs offering no-cost upgrades to higher speed service tiers during the pandemic. See: https://www.fcc.gov/companies-have-gone-above-and-beyond-call-keep-americans-connected-during-pandemic.
[18] While usage patterns changed to some extent during the course of the pandemic the standard test period was kept the same for longitudinal consistency and since usage patterns over other periods (i.e., during normal work/school hours) varied but the peak period remained relatively similar.
[19] For a detailed definition and discussion of this metric, please refer to the Technical Appendix.
[21] See: https://www.voip-info.org/wiki/view/QoS and http://www.ciscopress.com/articles/article.asp?p=357102
[22] Although Hawaiian Telcom participated in the Fixed MBA program, the number of panelists in the program receiving Hawaiian Telcom service was insufficient to result in a statistically valid dataset; therefore, this report does not include measurement results for Hawaiian Telcom
[23] Although Hawaiian Telcom participated in the Fixed MBA program, the number of panelists in the program receiving Hawaiian Telcom service was insufficient to result in a statistically valid dataset; therefore, this report does not include measurement results for Hawaiian Telcom.
[24] A smaller number of panelist results were used in the Report as compared to the much larger total pool of panelists because many of the panelists either were not reporting for a sufficient number of days within the measurement period in order to be considered as a statistically significant sample, or as explained above, there was an insufficient number of panelists in a particular tier or for a particular ISP to produce a statistically valid dataset.
[25] This proposed 30 day time period was chosen within the September-October validation period to provide an error-free reporting set of dates and to capture a time period where the maximum number of whiteboxes were reporting data. The date of September 25, 2020 was omitted due to downtime on one server. Omitting this date is consistent with the FCC’s data collection policy for fixed MBA data. See FCC, Measuring Fixed Broadband, Data Collection Policy, https://www.fcc.gov/general/measuring-broadband-america-measuring-fixed-broadband (explaining that the FCC has developed policies to deal with impairments in the data collection process with potential impact for the validity of the data collected).
[26] The MBA program uses test servers that are both neutral (i.e., operated by third parties that are not ISP-operated or owned) and located as close as practical, in terms of network topology, to the boundaries of the ISP networks under study. As described earlier in this section, a maximum of two interconnection points and one transit network may be on the test path in any one direction. If there is congestion on such paths to the test server, it may impact the measurement, but the cases where it does so are detectable by the test approach followed by the MBA program, which uses consistent longitudinal measurements, comparisons with control servers located on-net, comparisons with redundant offnet servers, and trend analyses of averaged results. Details of the methodology used in the MBA program are given in the Technical Appendix to this report.
[27] Independent research, drawing on the FCC’s MBA test platform, suggests that home networks are a significant source of end-to-end service congestion. See Srikanth Sundaresan et al., Home Network or Access Link? Locating Last-Mile Downstream Throughput Bottlenecks, PAM 2016 - Passive and Active Measurement Conference, at 111-123 (Mar. 2016). Numerous instances of research supported by the fixed MBA test platform are described at https://www.fcc.gov/general/mba-research-code-conduct#publications-mars….
[29] The September-October 2020 data set was validated to remove anomalies that would have produced errors in the Report. This data validation process is described in the Technical Appendix.
[30] The software that was used for the MBA program will be made available, on appropriate request, for noncommercial purposes. To apply for noncommercial review of the code, interested parties may contact SamKnows directly atteam@samknows.com, with the subject heading “Academic Code Review.”
[31] Measured service tiers were tiers which constituted the top 80% of an ISP’s broadband subscriber base.
[32] Please note that this average for Sept-Oct 2018 represents the average advertised upload speed with AT&T tiers removed, to facilitate. comparison with current results since AT&T is no longer an active participant in the MBA program. The actual weighted average upload speed for September-October 2018, as reported in the Ninth MBA Report, was 27.4 Mbps.
[33] In Reports prior to the 2015 MBA Report, for each ratio of actual to advertised download speed on the horizontal axis, the cumulative distribution function curves showed the percentage of measurements, rather than panelists subscribing to each ISP, that experienced at least this ratio. The methodology used since then, i.e., using panelists subscribing to each ISP, more accurately illustrates ISP performance from a consumer’s point of view.
[34] The speed achievable by DSL depends on the distance between the subscriber and the central office. Thus, the complementary cumulative distribution function will fall slowly unless the broadband ISP adjusts its advertised rate based on the subscriber’s location. (Chart 16 illustrates that the performance during non-busy hours is similar to the busy hour, making congestion less likely as an explanation.)