Ninth
Measuring Broadband America
Fixed Broadband Report
A Report on Consumer Fixed Broadband Performance
in the United States

Federal Communications Commission
Office of Engineering and Technology
Table of Contents
- Chart 1: Weighted average advertised download speed among the top 80% service tiers offered by each ISP
- Chart 2: Weighted average advertised download speed among the top 80% service tiers based on technology
- Chart 3: Consumer migration to higher advertised download speeds
- Chart 4: The ratio of weighted median speed (download and upload) to advertised speed for each ISP. Note Verizon advertises a speed range for both its download and upload DSL tier and hence appears as a range in this and other charts.
- Chart 5: The percentage of consumers whose median download speed was greater than 95%, between 80% and 95%, or less than 80% of the advertised download speed
- Chart 6: The ratio of 80/80 consistent median download speed to advertised download speed.
- Chart 7: Latency by ISP
- Chart 8: Percentage of consumers whose peak-period packet loss was less than 0.4%, between 0.4% to 1%, and greater than 1%
- Chart 9: Average webpage download time, by advertised download speed
- Chart 10: Weighted average advertised upload speed among the top 80% service tiers offered by each ISP
- Chart 11: Weighted average advertised upload speed among the top 80% service tiers based on technology
- Chart 12.1: The ratio of median download speed to advertised download speed
- Chart 12.2: The ratio of median upload speed to advertised upload speed.
- Chart 13: The percentage of consumers whose median upload speed was (a) greater than 95%, (b) between 80% and 95%, or (c) less than 80% of the advertised upload speed
- Chart 14.1: Complementary cumulative distribution of the ratio of median download speed to advertised download speed
- Chart 14.2: Complementary cumulative distribution of the ratio of median download speed to advertised download speed (continued)
- Chart 14.3: Complementary cumulative distribution of the ratio of median download speed to advertised download speed, by technology
- Chart 14.4: Complementary cumulative distribution of the ratio of median upload speed to advertised upload speed
- Chart 14.5: Complementary cumulative distribution of the ratio of median upload speed to advertised upload speed (continued)
- Chart 14.6: Complementary cumulative distribution of the ratio of median upload speed to advertised upload speed, by technology
- Chart 15.1: The ratio of weighted median download speed to advertised download speed, peak hours versus off-peak hours
- Chart 15.2: The ratio of weighted median upload speed to advertised upload speed, peak versus off-peak
- Chart 16: The ratio of median download speed to advertised download speed, Monday-to-Friday, two-hour time blocks, terrestrial ISPs
- Chart 17.1: The ratio of 80/80 consistent upload speed to advertised upload speed
- Chart 17.2: The ratio of 70/70 consistent download speed to advertised download speed
- Chart 17.3: The ratio of 70/70 consistent upload speed to advertised upload speed
- Chart 18: Latency for Terrestrial ISPs, by technology, and by advertised download speed.
- Chart 19.1: The ratio of median download speed to advertised download speed, by ISP (0-5 Mbps)
- Chart 19.2: The ratio of median download speed to advertised download speed, by ISP (6-10 Mbps)
- Chart 19.3: The ratio of median download speed to advertised download speed, by ISP (12-20 Mbps)
- Chart 19.4: The ratio of median download speed to advertised download speed, by ISP (25-30 Mbps)
- Chart 19.5: The ratio of median download speed to advertised download speed, by ISP (40-50 Mbps)
- Chart 19.6: The ratio of median download speed to advertised download speed, by ISP (60-75 Mbps)
- Chart 19.7: The ratio of median download speed to advertised download speed, by ISP (100-150 Mbps)
- Chart 19.8: The ratio of median download speed to advertised download speed, by ISP (200-300 Mbps)
- Chart 20.1: The ratio of median upload speed to advertised upload speed, by ISP (0.384 - 0.768 Mbps)
- Chart 20.2: The ratio of median upload speed to advertised upload speed, by ISP (0.896 – 1.5 Mbps)
- Chart 20.3: The ratio of median upload speed to advertised upload speed, by ISP (2-5 Mbps)
- Chart 20.4: The ratio of median upload speed to advertised upload speed, by ISP (10 - 20 Mbps)
- Chart 20.5: The ratio of median upload speed to advertised upload speed, by ISP (30 - 75 Mbps)
- Chart 20.6: The ratio of median upload speed to advertised upload speed, by ISP (100-150 Mbps)
- Chart 21.1: The percentage of consumers whose median download speed was greater than 95%, between 80% and 95%, or less than 80% of the advertised download speed, by service tier (DSL)
- Chart 21.2: The percentage of consumers whose median download speed was greater than 95%, between 80% and 95%, or less than 80% of the advertised download speed (cable)
- Chart 21.3: The percentage of consumers whose median download speed was greater than 95%, between 80% and 95%, or less than 80% of the advertised download speed (fiber and satellite)
- Chart 22.1: The percentage of consumers whose median upload speed was greater than 95%, between 80% and 95%, or less than 80% of the advertised upload speed (DSL)
- Chart 22.2: The percentage of consumers whose median upload speed was greater than 95%, between 80% and 95%, or less than 80% of the advertised upload speed (cable)
- Chart 22.3: The percentage of consumers whose median upload speed was greater than 95%, between 80% and 95%, or less than 80% of the advertised upload speed (fiber and satellite)
- Chart 23.1: Average webpage download time, by ISP (1.1-5 Mbps)
- Chart 23.2: Average webpage download time, by ISP (6-10 Mbps)
- Chart 23.3: Average webpage download time, by ISP (12-20 Mbps)
- Chart 23.4: Average webpage download time, by ISP (25-30 Mbps)
- Chart 23.5: Average webpage download time, by ISP (40-50 Mbps)
- Chart 23.6: Average webpage download time, by ISP (60-75 Mbps)
- Chart 23.7: Average webpage download time, by ISP (100-150 Mbps)
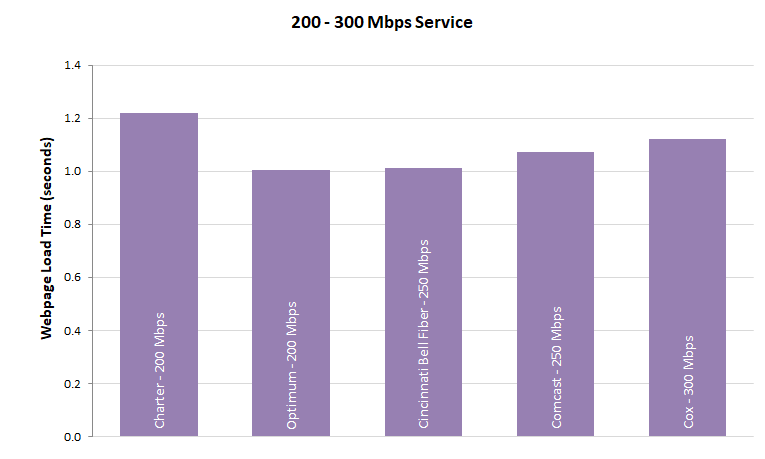
- Chart 23.8: Chart 23.8: Average webpage download time, by ISP (200-300 Mbps)
- Table 1: The most popular advertised service tiers
- Table 2: Peak Period Median download speed, by ISP
- Table 3: Complementary cumulative distribution of the ratio of median download speed to advertised download speed, by technology, by ISP
- Table 4: Complementary cumulative distribution of the ratio of median upload speed to advertised upload speed, by technology, by ISP
1.Executive Summary
The Ninth Measuring Broadband America Fixed Broadband Report (“Ninth Report” or “Report”) contains validated data collected in September and October 2018[1] from fixed Internet Service Providers (ISPs) as part of the Federal Communication Commission’s (FCC) Measuring Broadband America (MBA) program. This program is an ongoing, rigorous, nationwide study of consumer broadband performance in the United States. The goal of this program is to measure the network performance delivered on selected service tiers to a representative sample set of the population. Thousands of volunteer panelists are drawn from subscribers of Internet Service Providers serving over 80% of the residential marketplace[2].
The initial Measuring Broadband America Fixed Broadband Report was published in August 2011,[3] and presented the first broad-scale study of directly measured consumer broadband performance throughout the United States. As part of an open data program, all methodologies used in the program are fully documented, and all data collected is published for public use without any restrictions. Including this current Report, nine reports have now been issued.[4] These reports provide a snapshot of fixed broadband Internet access service performance in the United States. These reports present analysis of broadband information in a variety of ways and have evolved to make the information more understandable and useful, as well as, to reflect the evolving applications supported by the nation’s broadband infrastructure.
A. Major Findings Of The Ninth Report
The key findings of this report are:
These and other findings are described in greater detail within this report.
B.Speed Performance Metrics
Speed (both download and upload) performance continues to be one of the key metrics reported by the MBA. The data presented includes ISP broadband performance as a median[5] of speeds experienced by panelists within a specific service tier. These reports mainly focus on common service tiers used by an ISP’s subscribers.[6]
Additionally, consistent with previous Reports, we also compute ISP performance by weighting the median speed for each service tier by the number of subscribers in that tier. Similarly, in calculating the overall average speed of all ISPs in a specific year, the median speed of each ISP is used and weighted by the number of subscribers of that ISP as a fraction of the total number of subscribers across all ISPs.
In calculating these weighted medians, we have drawn on two sources for determining the number of subscribers per service tier. ISPs may either voluntarily contribute their data per surveyed service tier as the most recent and authoritative data. Many ISPs have chosen to do so.[7]. When such information has not been provided by an ISP, we instead rely on the FCC’s Form 477 data.[8] All facilities-based broadband providers are required to file data with the FCC twice a year (Form 477) regarding deployment of broadband services, including subscriber counts. For this report, we used the June 2018 Form 477 data. It should be noted that the Form 477 subscriber data values are for a month that generally lags the reporting month, and therefore, there are likely to be small inaccuracies in the tier ratios. It is for this reason that we encourage ISPs to provide us with subscriber numbers for the measurement month.
As in our previous reports, we found that for most ISPs, the actual speeds experienced by subscribers either nearly met or exceeded advertised service tier speeds. However, since we started our MBA program, consumers have changed their Internet usage habits. In 2011, consumers mainly browsed the web and downloaded files; thus, we reported average broadband speeds since these average speeds were likely to closely mirror user satisfaction. By contrast, in September-October 2018 (the measurement period for this report) consumer internet usage had become dominated by video consumption, with consumers regularly streaming video for entertainment and education.[9] Both the median measured speed and consistency in service are likely to influence the perception and usefulness of Internet access service. Therefore, our network performance analytics have been expanded to better capture this.
Specifically, we use two kinds of metrics to reflect the consistency of service delivered to the consumer: First, we report the percentage of advertised speed experienced by at least 80% of panelists during at least 80% of the daily peak usage period (“80/80 consistent speed” measure). Second, we show the fraction of consumers who obtain median speeds greater than 95%, between 80% and 95%, and less than 80% of advertised speeds.
C. Use Of Other Performance Metrics
Although download and upload speeds remain the network performance metric of greatest interest to the consumer, we also spotlight two other key network performance metrics in this report: latency and packet loss. These metrics can significantly affect the overall quality of Internet applications.
Latency is the time it takes for a data packet to travel across a network from one point on the network to another. High latencies may affect the perceived quality of some interactive services such as phone calls over the Internet, video chat and video conferencing, or online multiplayer games. All network access technologies have a minimum latency that is largely determined by the technology. In addition, network congestion will lead to an increase in measured latency. Technology-dependent latencies are typically small for terrestrial broadband services and are thus unlikely to affect the perceived quality of applications Additionally, for certain applications the user experience is not necessarily affected by high latencies. As an example, when using entertainment video streaming applications, because the data can be cached prior to display, the user experience is likely to be unaffected by relatively high latencies.
Packet loss measures the fraction of data packets sent that fail to be delivered to the intended destination. Packet loss may affect the perceived quality of applications that do not request retransmission of lost packets, such as phone calls over the Internet, video chat, some online multiplayer games, and some video streaming. High packet loss also degrades the achievable throughput of download and streaming applications. However, packet loss of a few tenths of a percent are unlikely to significantly affect the perceived quality of most Internet applications and are common. During network congestion, both latency and packet loss typically increase.
The Internet is continuing to evolve in its architectures, performances, and services. Accordingly, we will continue to adapt our measurement and analysis methodologies to help consumers understand the performance characteristics of their broadband Internet access service, and thus make informed choices about their use of such services.
2. Summary of Key Findings
A. Most Popular Advertised Service Tiers
A list of the ISP download and upload speed service tiers that were measured in this report are shown in Table 1. It should be noted that while upload and downloads speeds are measured independently and shown separately, they are typically offered by an ISP in a paired configuration. Together, these plans serve the majority of Internet users of the participating ISPs. The service tiers that are included for reporting represent the top 80% of an ISP’s set of tiers based on subscriber numbers.
Table 1: List of ISP service tiers whose broadband performance was measured in this report
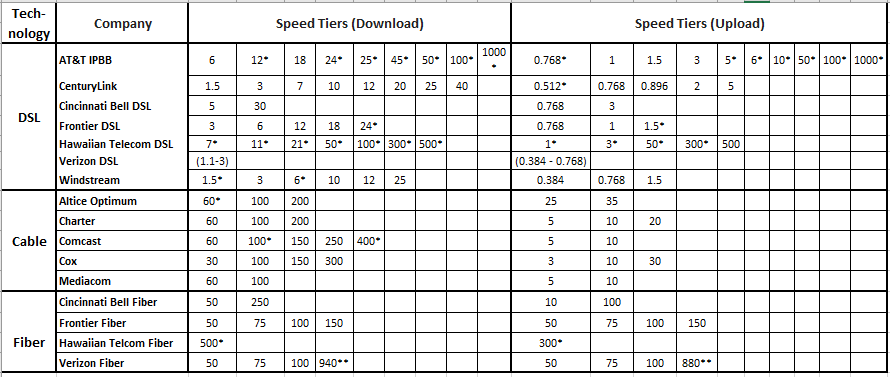
*Tiers that lack sufficient panelists to meet the program’s target sample size.
** Although Verizon Fiber’s 940/880 Mbps service tier was amongst the top 80% of Verizon’s offered tiers by subscription numbers, it is not included in the report charts because technical procedures for measuring high speed rates near Gigabit and above have not yet been established for the MBA program.
Chart 1 (below) displays the weighted (by subscriber numbers) mean of the top 80% advertised download speed tiers for each participating ISP for September-October 2018 as well as September 2017, grouped by the access technology used to offer the broadband Internet access service (DSL, cable or fiber). In September-October 2018, the weighted average advertised download speed was 123.3 Mbps among the measured ISPs, which represents an 96% increase compared to the average in September 2017 which was 62.9Mbps.
Chart 1: Weighted average advertised download speed among the top 80% service tiers offered by each ISP
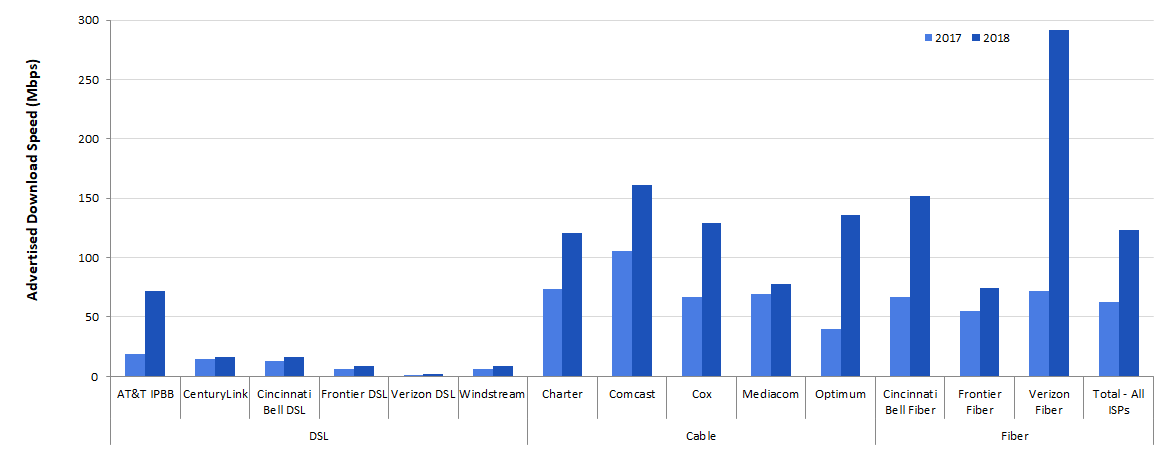
Among participating broadband ISPs, only AT&T IPBB[10], Cincinnati Bell, Hawaiian Telcom fiber, Frontier, and Verizon use fiber as the access technology for a substantial number of their customers and their maximum speed offerings range from 150 Mbps to 1 Gbps. A key difference between the fiber vendors and other technology vendors is that (with the exception of Cincinnati Bell), most fiber vendors advertise generally symmetric upload and download speeds. This is in sharp contrast to the asymmetric offerings for all the other technologies, where the upload advertised speeds are typically 5 to 10 times below the download advertised speeds.
It should be noted that there is also considerable difference between the offered average weighted speed tier by technology. Chart 2 plots the weighted average of the top 80% ISP tiers by technology both for September 2017 as well as September-October 2018. As can be seen in this chart, all technologies showed increases in the set of advertised download speeds by ISPs. For the September-October 2018 period, the weighted mean advertised speeds for DSL technology was 50 Mbps which lagged considerably behind the weighted mean advertised download speeds for cable and fiber technologies, which were 139 Mbps and 251 Mbps respectively. Fiber technology showed the greatest increase in speed offerings in 2018 compared to 2017 with a weighted mean going up from 70 Mbps to 251 Mbps representing a 258% increase. In comparison, DSL and cable technologies showed 96%, and 64% increase from 2017 to 2018.
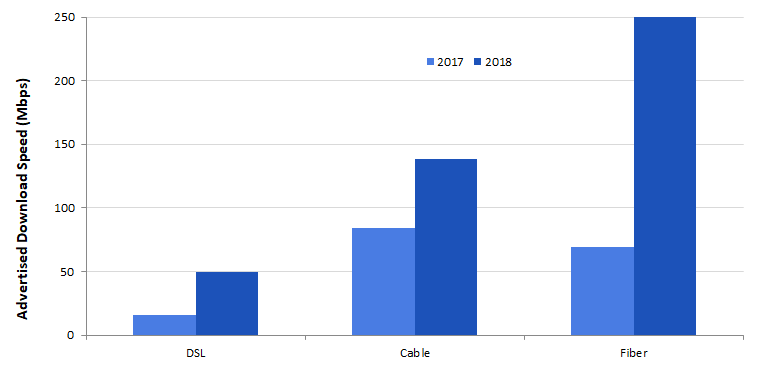
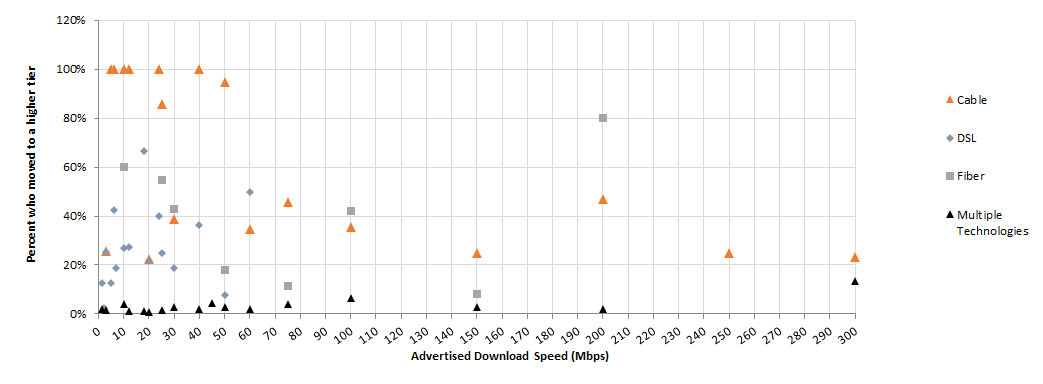
Chart 3 plots the migration of panelists to a higher service tier based on their access technology.[11] Specifically, the horizontal axis of Chart 3 partitions the September 2017 panelists by the advertised download speed of the service tier to which they were subscribed. For each such set of panelists who also participated in the September-October 2018 collection of data,[12] the vertical axis of Chart 3 displays the percentage of panelists that migrated by September-October 2018 to a service tier with a higher advertised download speed. There are two ways that such a migration could occur: (1) if a panelist changed their broadband plan during the intervening year to a service tier with a higher advertised download speed, or (2) if a panelist did not change their broadband plan but the panelist’s ISP increased the advertised download speed of the panelist’s subscribed plan.[13]
Chart 3: Consumer migration to higher advertised download speeds
B. Median download speeds
Advertised download speeds may differ from the speeds that subscribers actually experience. Some ISPs more consistently meet network service objectives than others or meet them unevenly across their geographic coverage area. Also, speeds experienced by a consumer may vary during the day if the network cannot carry the aggregate user demand during busy hours. Unless stated otherwise, all actual speeds were measured only during peak usage periods, which we define as 7 p.m. to 11 p.m. local time.
To compute the average ISP performance, we determine the ratio of the median speed for each tier to the advertised tier speed and then calculate the weighted average of these based on the subscriber count per tier. Subscriber counts for the weightings were provided from the ISPs themselves or, if unavailable, from FCC Form 477 data.
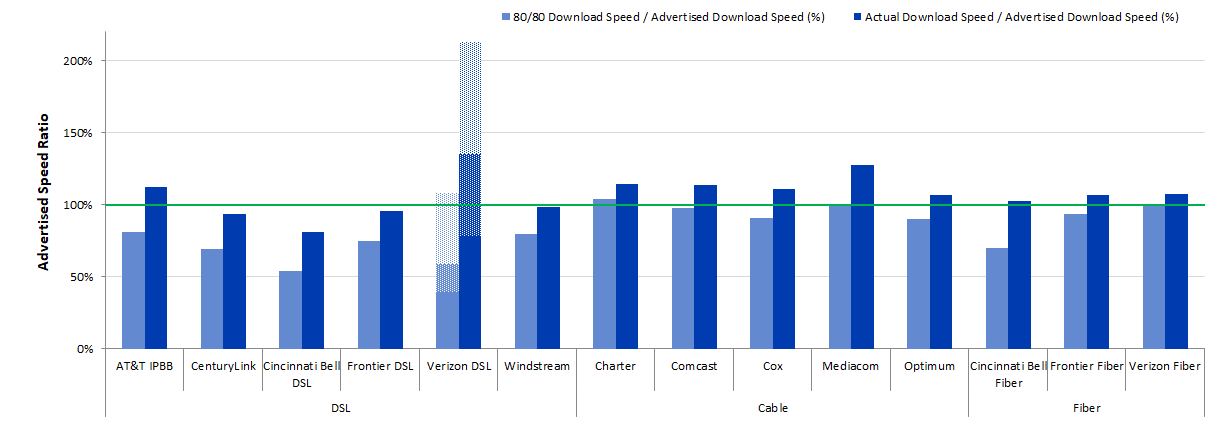
Chart 4 shows the ratio of the median download and upload speeds experienced by an ISP’s subscribers to that ISP’s advertised download and upload speeds weighted by the subscribership numbers for the tiers. The actual speeds experienced by most ISPs’ subscribers are close to or exceed the advertised speeds. However, DSL broadband ISPs continue to advertise “up-to” speeds that on average exceed the actual speeds experienced by their subscribers. Verizon, instead, advertises a speed range for DSL performance and has requested that we include this range in relevant charts; we indicate this speed range by shading on all bar charts describing Verizon’s DSL performance. Out of the 14 ISP/technology configurations shown, 10 met or exceeded their advertised download speed and three more reached at least 90% of their advertised download speed. Only Cincinnati-DSL (at 81%) performed below 90% of its advertised download speed.
Chart 4: The ratio of weighted median speed (download and upload) to advertised speed for each ISP. Note Verizon advertises a speed range for both its download and upload DSL tier and hence appears as a range in this and other charts.

C. Variations In Speeds
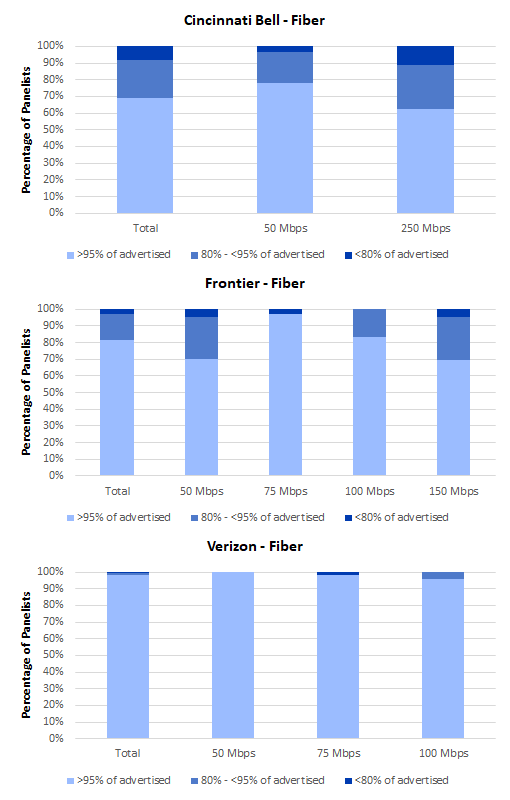
As discussed earlier, actual speeds experienced by individual consumers may vary by location and time of day. Chart 5 shows, for each ISP, the percentage of panelists who experienced a median download speed (averaged over the peak usage period during our measurement period) that was greater than 95%, between 80% and 95%, or less than 80% of the advertised download speed.
Chart 5: The percentage of consumers whose median download speed was greater than 95%, between 80% and 95%, or less than 80% of the advertised download speed
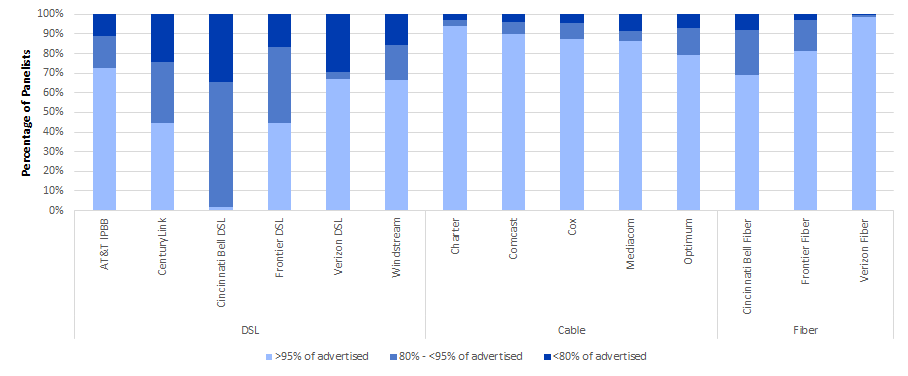
ISPs using DSL technology had between 2% to 73% of their subscribers getting greater than or equal to 95% of their advertised download speeds during peak hours. ISPs using cable technology and fiber technology had between 79%-94% and between 69%-98%, respectively, of their subscribers getting equal to or better than 95% of their advertised download speeds.
Though the median download speeds experienced by most ISPs’ subscribers nearly met or exceeded the advertised download speeds, there are some customers of each ISP for whom the median download speed fell significantly short of the advertised download speed. Relatively few subscribers of cable or fiber broadband service experienced this. The best performing ISPs, when measured by this metric, are Charter, Comcast, Cox, Mediacom, Frontier-Fiber and Verizon-Fiber; more than 80% of their panelists were able to attain an actual median download speed of at least 95% of the advertised download speed.
In addition to variations based on a subscriber’s location, speeds experienced by a consumer may fluctuate during the day. This is typically caused by increased traffic demand and the resulting stress on different parts of the network infrastructure. To examine this aspect of performance, we use the term “80/80 consistent speed”. This metric is designed to assess temporal and spatial variations in measured values of a user’s download speed.[14] While consistency of speed is in itself an intrinsically valuable service characteristic, its impact on consumers will hinge on variations in usage patterns and needs. As an example, a good consistency of speed measure is likely to indicate a higher quality of service experience for internet users consuming video content.
Chart 6 summarizes, for each ISP, the ratio of 80/80 consistent median download speed to advertised download speed, and, for comparison, the ratio of median download speed to advertised download speed shown previously in Chart 4. The ratio of 80/80 consistent median download speed to advertised download speed is less than the ratio of median download speed to advertised download speed for all participating ISPs due to congestion periods when median download speeds are lower than the overall average. When the difference between the two ratios is small, the median download speed is fairly insensitive to both geography and time. When the difference between the two ratios is large, there is a greater variability in median download speed, either across a set of different locations or across different times during the peak usage period at the same location.
Chart 6: The ratio of 80/80 consistent median download speed to advertised download speed.
D. Latency
Latency is the time it takes for a data packet to travel from one point to another in a network. It has a fixed component that depends on the distance, the transmission speed, and transmission technology between the source and destination, and a variable component that increases as the network path congests with traffic. The MBA program measures latency by measuring the round-trip time from the consumer’s home to the closest measurement server and back.
Chart 7 shows the median latency for each participating ISP. In general, higher-speed service tiers have lower latency, as it takes less time to transmit each packet. The median latencies ranged from 9.5 ms to 36 ms in our measurements (with the exception of Verizon DSL which had a median latency of 42 ms).
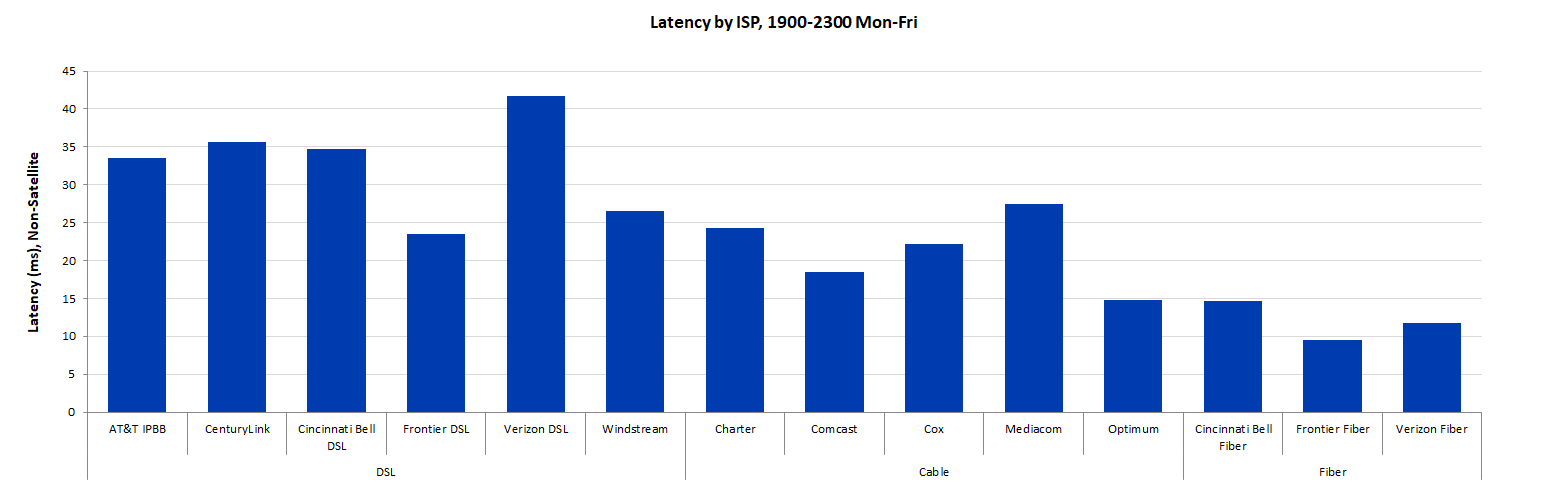
DSL latencies (between 24 ms to 42 ms) were slightly higher than those for cable (15 ms to 27 ms). Fiber ISPs showed the lowest latencies (10 ms to 15 ms). The differences in median latencies among terrestrial-based broadband services are relatively small and are unlikely to affect the perceived quality of highly interactive applications.
E. Packet Loss
Packet loss is the percentage of packets that are sent by a source but not received at the intended destination. The most common causes of packet loss are high latency or encountered congestion along the network route. A small amount of packet loss is expected, and indeed packet loss is commonly used by some Internet protocols to infer Internet congestion and to adjust the sending rate to mitigate for the congestion. The MBA program considers a packet lost if the packet’s round-trip latency exceeds 3 seconds.
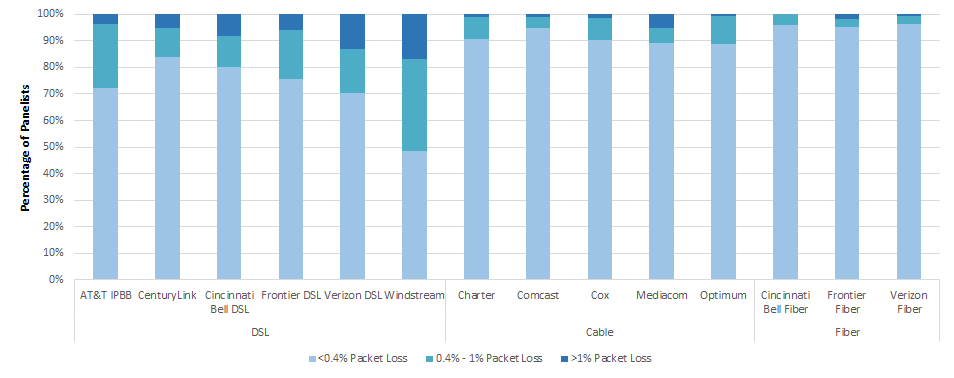
Chart 8 shows the average peak-period packet loss for each participating ISP, grouped into bins. We have broken the packet loss performance into three bands, allowing a more granular view of the packet loss performance of the ISP network. The breakpoints for the three bins used to classify packet loss have been chosen with an eye towards balancing commonly accepted packet loss standards and provider packet loss Service Level Agreements (SLAs). Specifically, the 1% standard for packet loss is commonly accepted as the point at which highly interactive applications such as VoIP experience significant degradation and quality according to international documents.[15] The 0.4% breakpoint was chosen as a generic breakpoint between the highly desired performance of 0% packet loss described in many documents and the 1% unacceptable limit on the high side. The specific value of 0.4% is based upon a compromised value between those two limits and is generally supported by many SLAs and major ISPs for network performance. Indeed, most SLAs support 0.1% to 0.3% SLA packet loss guarantees,[16] but these are generally for enterprise level services which generally have more stringent requirements for higher-level performance.
Chart 8: Percentage of consumers whose peak-period packet loss was less than 0.4%, between 0.4% to 1%, and greater than 1%.
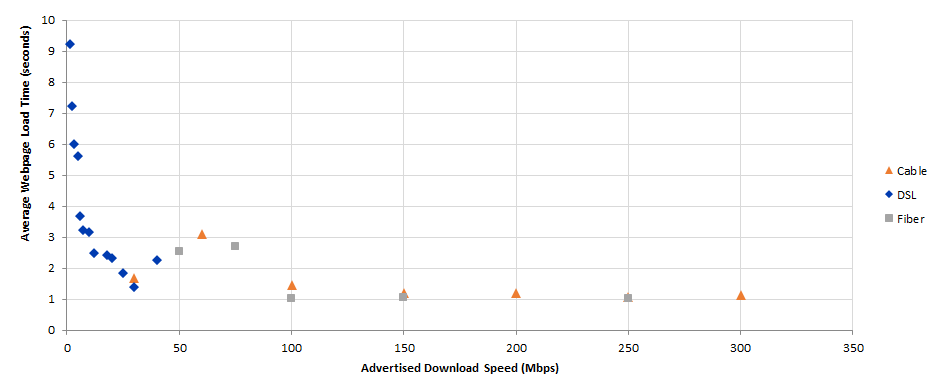
F. Web browsing performance
The MBA program also conducts a specific test to gauge web browsing performance. The web browsing test accesses nine popular websites that include text and images, but not streaming video. The time required to download a webpage depends on many factors, including the consumer’s in-home network, the download speed within an ISP’s network, the web server’s speed, congestion in other networks outside the consumer’s ISP’s network (if any), and the time required to look up the network address of the webserver. Only some of these factors are under control of the consumer’s ISP. Chart 9 displays the average webpage download time as a function of the advertised download speed. As shown by this chart, webpage download time decreases as download speed increases, from about 9.3 seconds at 1.5 Mbps download speed to about 1.4-1.7 seconds for 30 Mbps download speed. Subscribers to service tiers exceeding 25 Mbps experience slightly smaller webpage download times decreasing to 1.1 second at 300 Mbps. These download times assume that only a single user is using the Internet connection when the webpage is downloaded, and does not account for more common scenarios, where multiple users within a household are simultaneously using the Internet connection for viewing web pages, as well as other applications such as real-time gaming or video streaming.
Chart 9: Average webpage download time, by advertised download speed.
3. Methodology
A. Participants
Eleven ISPs participated in the Fixed MBA program in September-October 2018.[17] They were:
The methodologies and assumptions underlying the measurements described in this Report are reviewed at meetings that are open to all interested parties and documented in public ex parte letters filed in the GN Docket No. 12-264. Policy decisions regarding the MBA program were discussed at these meetings prior to adoption, and involved issues such as inclusion of tiers, test periods, mitigation of operational issues affecting the measurement infrastructure, and terms-of-use notifications to panelists. Participation in the MBA program is open and voluntary. Participants include members of academia, consumer equipment vendors, telecommunications vendors, network service providers, consumer policy groups as well as our contractor for this project, SamKnows. In 2018-2019, participants at these meetings (collectively and informally referred to as “the broadband collaborative”), included all eleven participating ISPs and the following additional organizations:
Participants have contributed in important ways to the integrity of this program and have provided valuable input to FCC decisions for this program. Initial proposals for test metrics and testing platforms were discussed and critiqued within the broadband collaborative. M-Lab and Level 3 contributed their core network testing infrastructure, and both parties continue to provide invaluable assistance in helping to define and implement the FCC testing platform. We thank all the participants for their continued contributions to the MBA program.
B. Measurement process
The measurement servers used by the MBA program were hosted by M-Lab and Level 3 Communications, and were located in eleven cities (often with multiple locations within each city) across the United States near a point of interconnection between the ISP’s network and the network on which the measurement server resided.
The measurement clients collected data throughout the year, and this data is available as described below. However, only data collected from September 25 through October 25, 2018, referred to throughout this report as the “September-October 2018” reporting period, were used to generate the charts in this Report.[18]
Broadband performance varies with the time of day. At peak hours, more people tend to use their broadband Internet connections, giving rise to a greater potential for network congestion and degraded user performance. Unless otherwise stated, this Report focuses on performance during peak usage period, which is defined as weeknights between 7:00 p.m. to 11:00 p.m. local time at the subscriber’s location. Focusing on peak usage period provides the most useful information because it demonstrates what performance users can expect when the Internet in their local area experiences the highest demand from users.
Our methodology focuses on the network performance of each of the participating ISPs. The metrics discussed in this Report are derived from active measurements, i.e., test-generated traffic flowing between a measurement client, located within the modem/router within a panelist’s home, and a measurement server, located outside the ISP’s network. For each panelist, the tests automatically choose the measurement server that has the lowest latency to the measurement client. Thus, the metrics measure performance along the path followed by the measurement traffic within each ISP’s network, through a point of interconnection between the ISP’s network and the network on which the chosen measurement server is located.
However, the service performance that a consumer experiences could differ from our measured values for several reasons.
First, as noted, in the course of each test instance, we measure performance only to a single measurement server rather than to multiple servers. This is consistent with the approach chosen by most network measurement tools. As a point of comparison, the average web page may load its content from a multiplicity of end points.
In addition, bottlenecks or congestion points in the full path traversed by consumer application traffic might also impact a consumer’s perception of Internet service performance. These bottlenecks may exist at various points: within the ISP’s network, beyond its network (depending on the network topology encountered en route to the traffic destination), in the consumer’s home, on the Wi-Fi used to access the in-home access router, or from a shortfall of capacity at the far end point being accessed by the application. The MBA tests explore how a service performs from the point at which a fixed ISP’s Internet service is delivered to the home on fixed infrastructure (deliberately excluding Wi-Fi, due to the many confounding factors associated with it) to the point at which the test servers are located. As MBA tests are designed to focus on the access to the ISP’s network, they will not include phenomena at most interconnection points or transit networks that consumer traffic may traverse.
To the extent possible[19] the MBA focuses on performance within an ISP’s network. It should be noted that the overall performance a consumer experiences with their service can also be affected by congestion such as may arise at other points in the path potentially taken by consumer traffic (e.g., in-home Wi-Fi, peering points, transit networks etc.) but this does not get reflected in MBA measurements.
A consumer’s home network, rather than the ISP’s network, may be the bottleneck with respect to network congestion. We measure the performance of the ISP’s service delivered to the consumer’s home network, but this service is often shared simultaneously among multiple users and applications within the home. In-home networks, which typically includes Wi-Fi, may not have sufficient capacities to support peak loads.[20]
In addition, consumers’ experience of ISP performance is manifested through the set of applications they utilize. The overall performance of an application depends not only on the network performance (i.e., raw speed, latency or packet loss) but also on the application’s architecture and implementation and on the operating system and hardware on which it runs. While network performance is considered in this Report, application performance is generally not.
C. Measurement Tests And Performance Metrics
This Report is based on the following measurement tests:
This Report focuses on three key performance metrics of interest to consumers of broadband Internet access service, as they are likely to influence how well a wide range of consumer applications work: download and upload speed, latency, and packet loss. Download and upload speeds are also the primary network performance characteristic advertised by ISPs. However, as discussed above, the performance observed by a user in any given circumstance depends not only on the actual speed of the ISP’s network, but also on the performance of other parts of the Internet and on that of the application itself.
The standard speed tests use TCP with 8 concurrent TCP sessions. In 2017 we also introduced a single TCP speed test (termed as Lightweight tests), which ran less frequently and thereby provided less strain on consumer accounts that are data-capped. The Lightweight tests are used exclusively to provide broadband performance results for satellite ISPs. The Technical Appendix to this Report describes each test in more detail, including additional tests not contained in this Report.
D. Availability Of Data
The Validated Data Set[21] on which this Report is based, as well as the full results of all tests, are available at http://www.fcc.gov/measuring-broadband-america. To encourage additional research, we also provide raw data for the reference month and other months. Previous reports of the MBA program, as well as the data used to produce them, are also available there.
Both the Commission and SamKnows, the Commission’s contractor for this program, recognize that, while the methodology descriptions included in this document provide an overview of the project, interested parties may be willing to contribute to the project by reviewing the software used in the testing. SamKnows welcomes review of its software and technical platform, consistent with the Commission’s goals of openness and transparency for this program.[22]
4. Test Results
A. Most Popular Advertised Service Tiers
Chart 1 above summarizes the weighted average of the advertised download speeds[23] for each participating ISP, for September-October 2018 and September 2017 where the weighting is based upon the number of subscribers to each tier, grouped by the access technology used to offer the broadband Internet access service (DSL, cable, or fiber). Only the top 80% tiers (by subscriber number) of each ISP were included. Chart 10 below shows the corresponding weighted average of the advertised upload speeds among the measured ISPs. The computed weighted average of the advertised upload speed of all the ISPs is 27 Mbps representing a 141% increase over the previous year’s value of 11 Mbps.
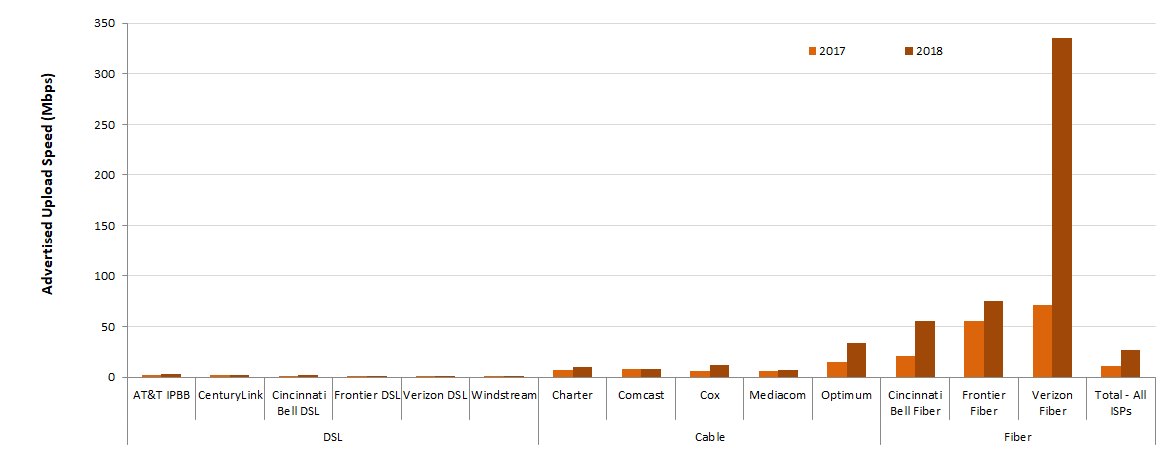
Chart 11 compares the weighted average of the advertised upload speeds by technology both for September 2017 and September-October 2018. As can be seen in this chart, all technologies showed increased rates in 2018 as compared to 2017. However, the rates of increase were not the same for all technologies. The rate of increase in the weighted average of Fiber technology was 308% compared to DSL and Cable which were 22% and 31 % respectively.
Observing both the download and upload speeds, it is clear that fiber service tiers are generally symmetric in their actual upload and download speeds. This results from the fact that fiber technology has significantly more capacity than other technologies and it can be engineered to have symmetric upload and download speeds. For other technologies with more limited capacity, higher capacity is usually allocated to download speeds than to upload speeds, typically in ratios ranging from 5:1 to 10:1. This resulting asymmetry in download/upload speeds is reflective of actual usage because consumers typically download significantly more data than they upload.

B. Observed Median download and upload Speeds
Chart 4 (in Section 2.B) shows the ratio in September-October 2018 of the weighted median of both download and upload speeds of each ISP’s subscribers to advertised speeds. Charts 12.1 and 12.2 below show the same ratios separately for download speed and for upload speed.[24] The median download speeds of most ISPs’ subscribers have been close to, or have exceeded, the advertised speeds. Exceptions to this were the following DSL providers: CenturyLink, Cincinnati Bell DSL, Frontier DSL and Windstream with respective ratios of 94%, 81%, 96% and 98%.
Chart 12.1: The ratio of median download speed to advertised download speed.

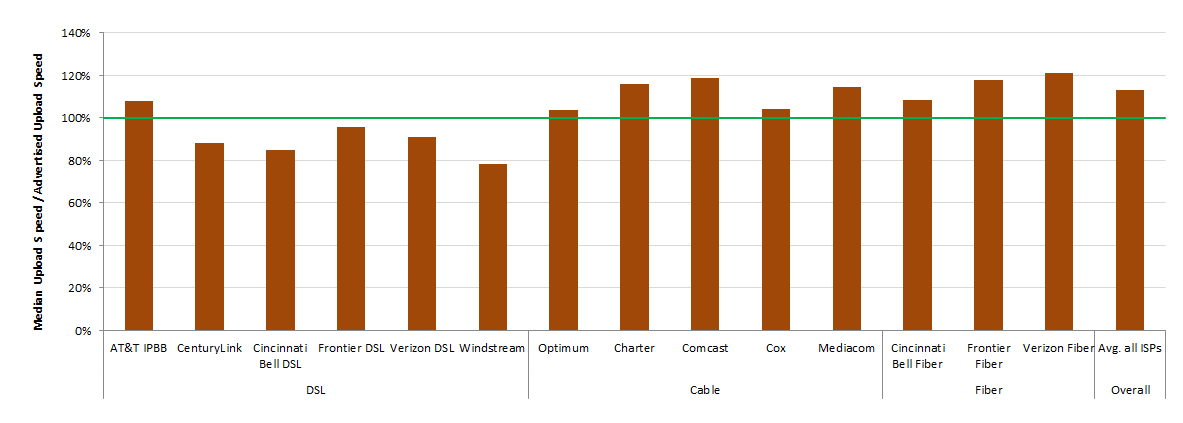
Chart 12.2 shows the median upload speed as a percentage of the advertised speed. As was the case with download speeds most ISPs met or exceeded the advertised rates except for a number of DSL providers: CenturyLink, Cincinnati Bell DSL, Frontier DSL, Verizon DSL and Windstream which had respective ratios of 88%, 85%, 96%, 91% and 78%.
Chart 12.2: The ratio of median upload speed to advertised upload speed.
C. Variations In Speeds
Median speeds experienced by consumers may vary based on location and time of day. Chart 5 above showed, for each ISP, the percentage of consumers (across the ISP’s service territory) who experienced a median download speed over the peak usage period that was either greater than 95%, between 80% and 95%, or less than 80% of the advertised download speed. Chart 13 below shows the corresponding percentage of consumers whose median upload speed fell in each of these ranges. With the exception of AT&T IPBB, ISPs using DSL technology had between 20% and 49% of their subscribers getting greater than or equal to 95% of their advertised upload speeds during peak hoursISPs using cable or fiber technology had between 90% - 99% of their subscribers getting equal to or better than 95% of their advertised upload speeds.
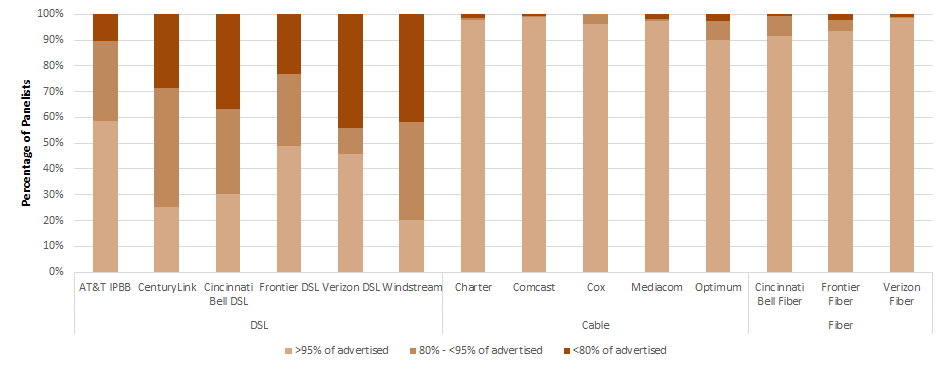
Though the median upload speeds experienced by most subscribers were close to or exceeded the advertised upload speeds there were some subscribers, for each ISP, whose median upload speed fell significantly short of the advertised upload speed. This issue was most prevalent for ISPs using DSL technology. On the other hand, ISPs using cable and fiber technology generally showed very good consistency based on this metric.
We can learn more about the variation in network performance by separately examining variations across geography and across time. We start by examining the variation across geography within each participating ISP’s service territory. For each ISP, we first calculate the ratio of the median download speed (over the peak usage period) to the advertised download speed for each panelist subscribing to that ISP. We then examine the distribution of this ratio across the ISP’s service territory.
Charts 14.1 and 14.2 show the complementary cumulative distribution of the ratio of median download speed (over the peak usage period) to advertised download speed for each participating ISP. For each ratio of actual to advertised download speed on the horizontal axis, the curves show the percentage of panelists subscribing to each ISP that experienced at least this ratio.[25] For example, the Cincinnati Bell fiber curve in Chart 14.1 shows that 90% of its subscribers experienced a median download speed exceeding 83% of the advertised download speed, while 70% experienced a median download speed exceeding 95% of the advertised download speed, and 50% experienced a median download speed exceeding 102% of the advertised download speed.
Chart 14.1: Complementary cumulative distribution of the ratio of median download speed to advertised download speed.
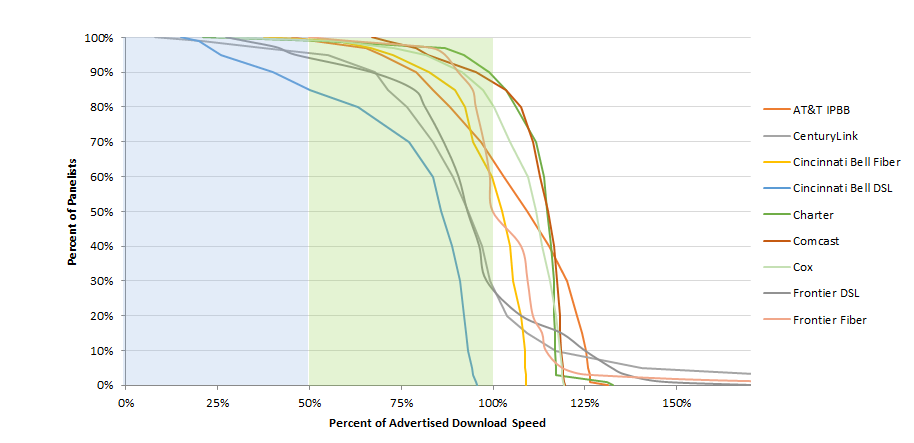
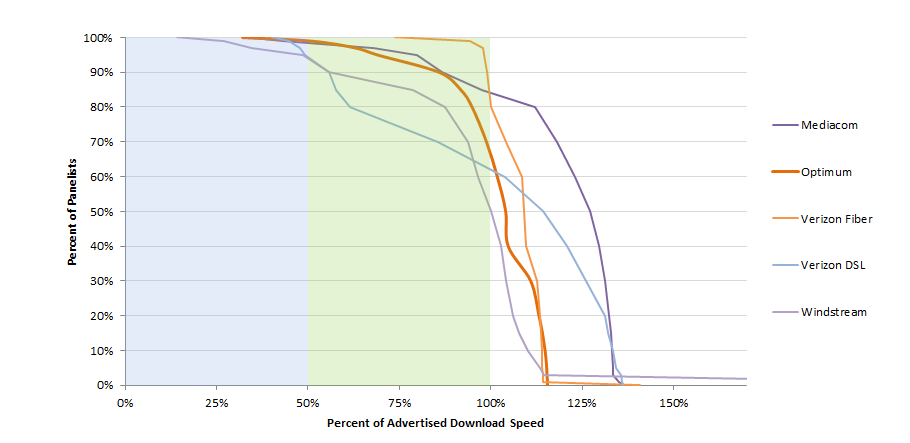
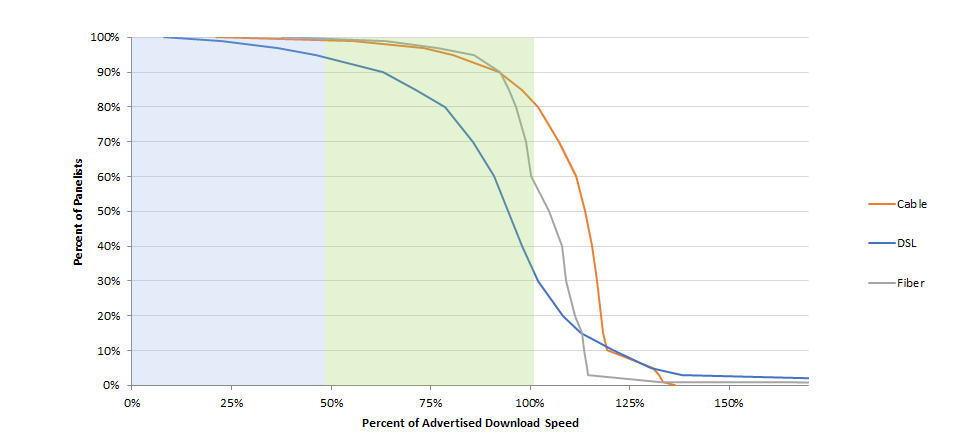
The curves for cable-based broadband and fiber-based broadband are steeper than those for DSL-based broadband. This can be seen more clearly in Chart 14.3, which plots aggregate curves for each technology. Approximately 80% of subscribers to cable and 60% of subscribers to fiber-based technologies experience median download speeds exceeding the advertised download speed. In contrast, only 30% of subscribers to DSL-based services experience median download speeds exceeding the advertised download speed.[26]
Chart 14.3: Complementary cumulative distribution of the ratio of median download speed to advertised download speed, by technology.
Charts 14.4 to 14.6 show the complementary cumulative distribution of the ratio of median upload speed (over the peak usage period) to advertised upload speed for each participating ISP (Charts 14.4 and 14.5) and by access technology (Chart 14.6).
Chart 14.4: Complementary cumulative distribution of the ratio of median upload speed to advertised upload speed.
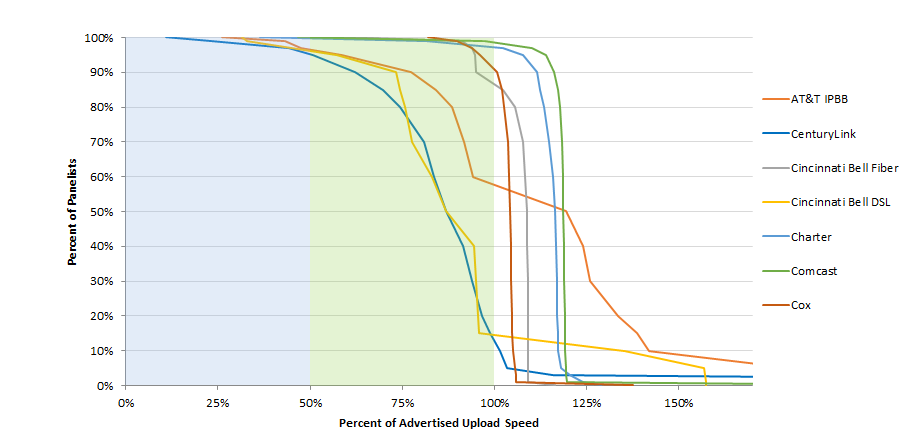
Chart 14.5: Complementary cumulative distribution of the ratio of median upload speed to advertised upload speed (continued).
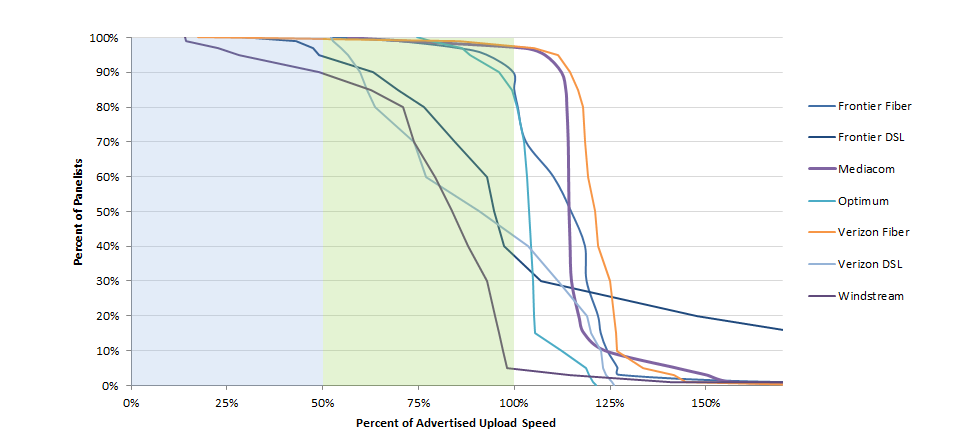
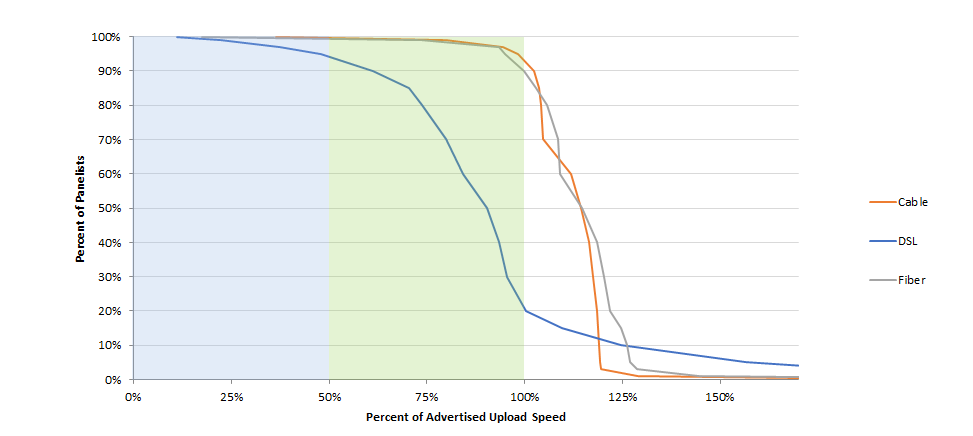
Chart 14.6: Complementary cumulative distribution of the ratio of median upload speed to advertised upload speed, by technology.
All actual speeds discussed above were measured during peak usage periods. In contrast, Charts 15.1 and 15.2 below compare the ratio of actual download and upload speeds to advertised download and upload speeds during peak and off-peak times.[27] Charts 15.1 and 15.2 show that most ISP subscribers experience only a slight degradation from off-peak to peak hour performance.
Chart 15.1: The ratio of weighted median download speed to advertised download speed, peak hours versus off-peak hours.
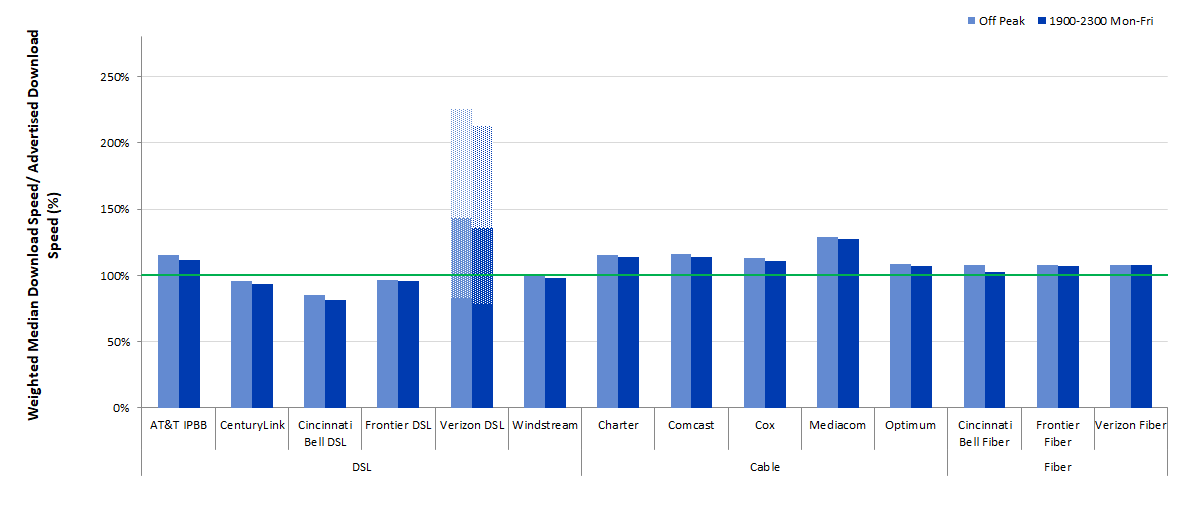
Chart 15.2: The ratio of weighted median upload speed to advertised upload speed, peak versus off-peak.
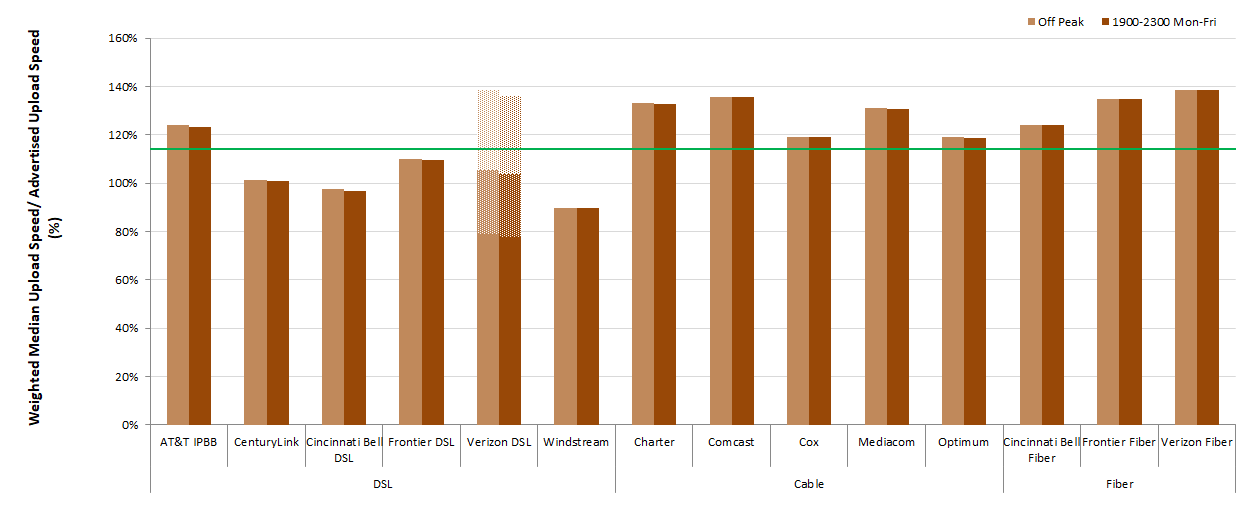
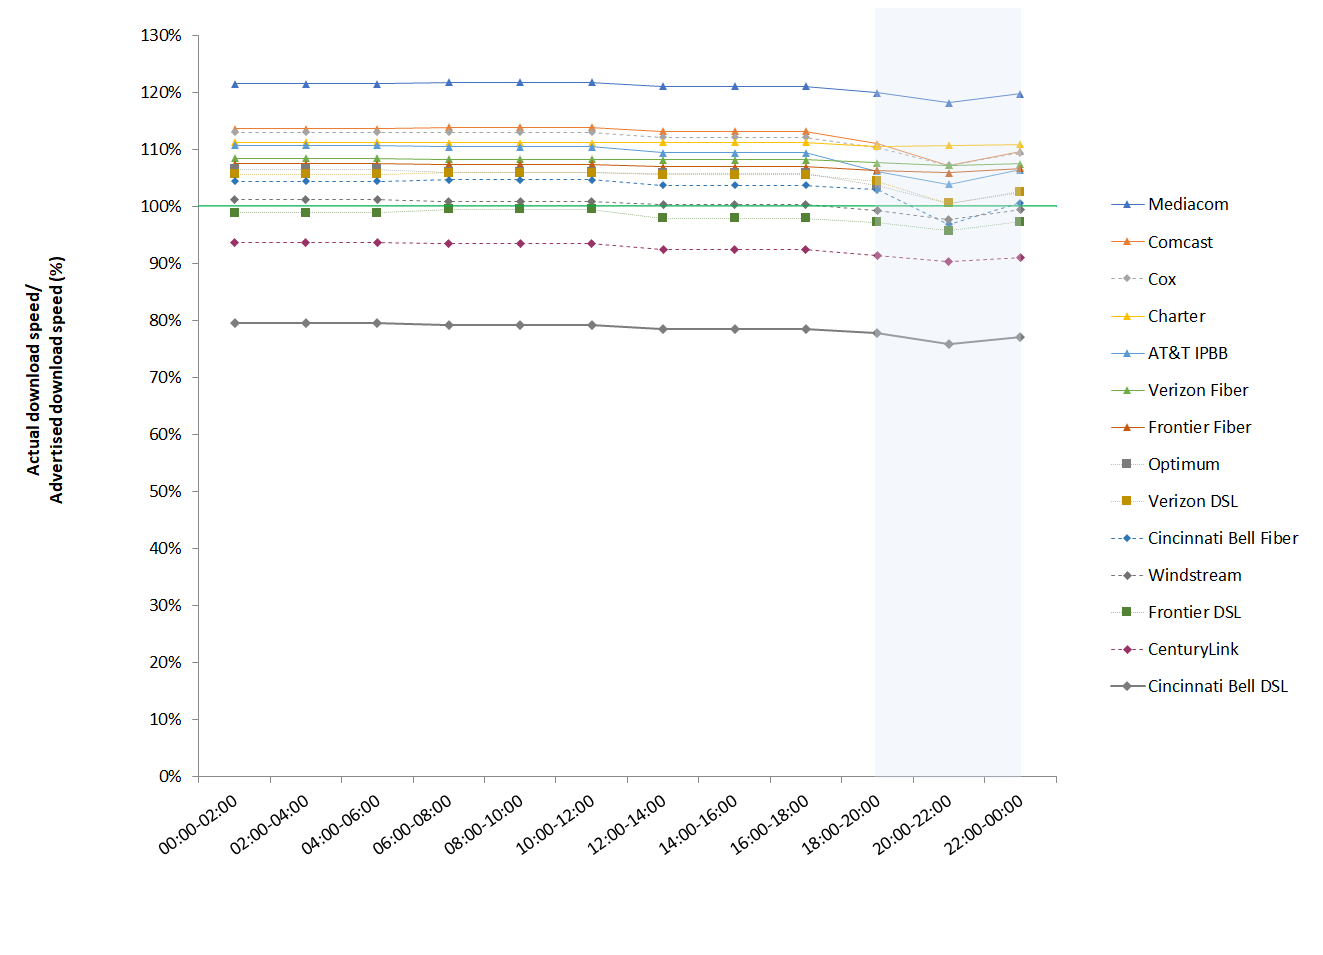
Chart 16[28] below shows the actual download speed to advertised speed ratio in each two-hour time block during weekdays for each ISP. The ratio is lowest during the busiest four-hour time block (7:00 p.m. to 11:00 p.m.).
Chart 16: The ratio of median download speed to advertised download speed, Monday-to-Friday, two-hour time blocks, terrestrial ISPs.
For each ISP, Chart 6 (in section 2.C) showed the ratio of the 80/80 consistent median download speed to advertised download speed, and for comparison, Chart 4 showed the ratio of median download speed to advertised download speed.
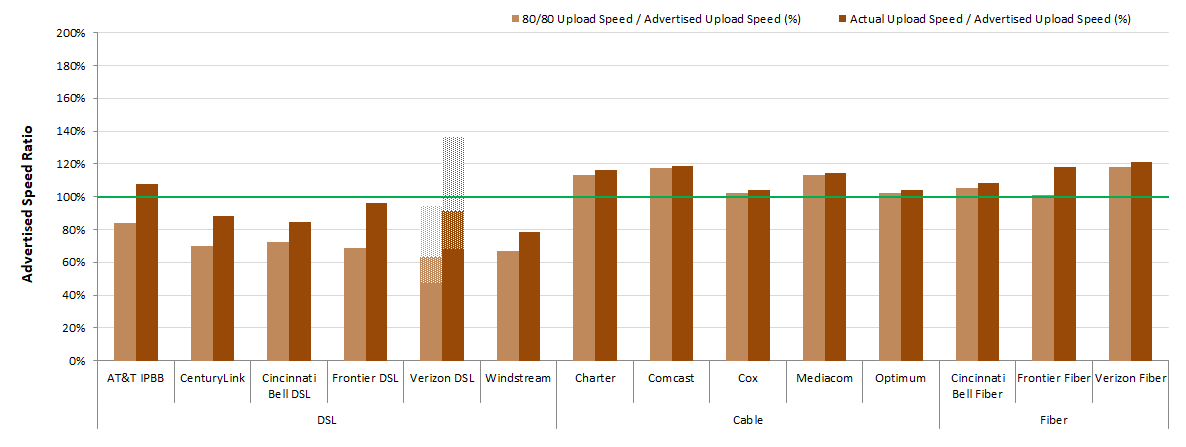
Chart 17.1 illustrates information concerning 80/80 consistent upload speeds. While all the upload 80/80 speeds were slightly lower than the median speed the differences were more marked in DSL. Charts 6 and 17.1 make it clear that cable and fiber technologies behaved more consistently than DSL technology both for download as well as upload speeds.
Chart 17.1: The ratio of 80/80 consistent upload speed to advertised upload speed.
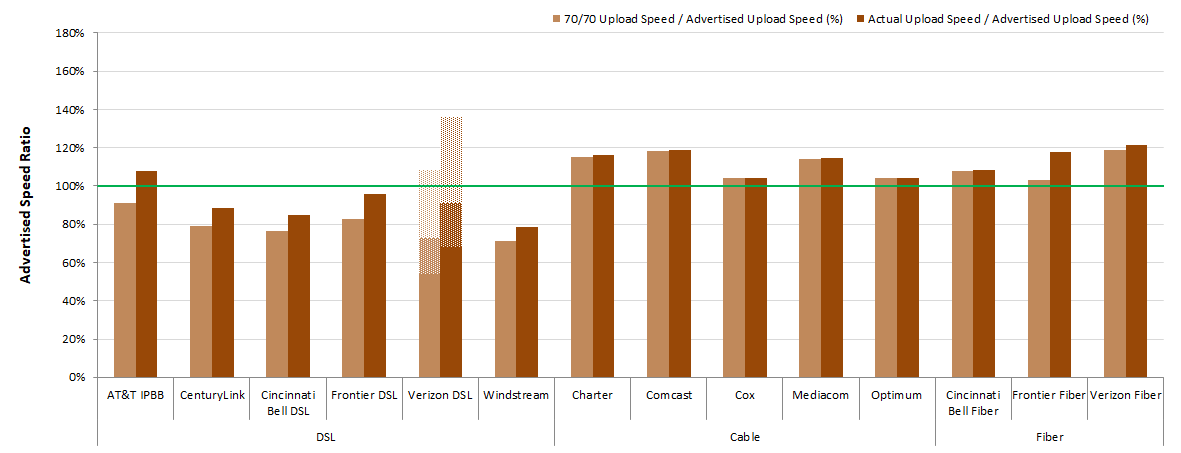
Charts 17.2 and 17.3 below illustrate similar consistency metrics for 70/70 consistent download and upload speeds, i.e., the minimum download or upload speed (as a percentage of the advertised download or upload speed) experienced by at least 70% of panelists during at least 70% of the peak usage period. The ratios for 70/70 consistent speeds as a percentage of the advertised speed are higher than the corresponding ratios for 80/80 consistent speeds. In fact, for many ISPs, the 70/70 consistent download or upload speed is close to the median download or upload speed. Once again, ISPs using DSL technology showed a considerably smaller value for the 70/70 download and upload speeds as compared to the download and upload median speeds, respectively.
Chart 17.2: The ratio of 70/70 consistent download speed to advertised download speed.

Chart 17.3: The ratio of 70/70 consistent upload speed to advertised upload speed.
D. Latency
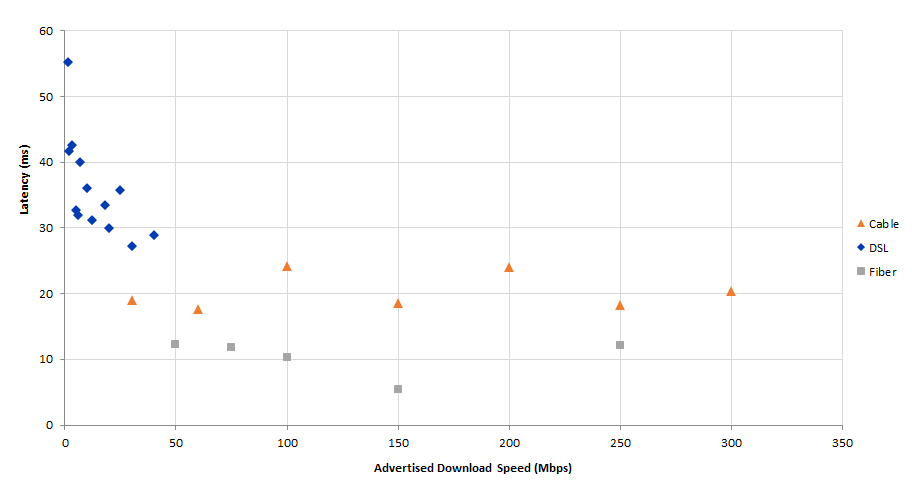
Chart 18 below shows the weighted median latencies, by technology and by advertised download speed for terrestrial technologies. For all terrestrial technologies, latency varied little with advertised download speed. DSL service typically had higher latencies, and lower latency was better correlated with advertised download speed, than with either cable or fiber. Cable latencies ranged between 18ms to 24ms, fiber latencies between 5ms to 12ms, and DSL between 27ms to 55ms.
Chart 18: Latency for Terrestrial ISPs, by technology, and by advertised download speed.
5. Additional Test Results
A. Actual Speed, By Service Tier
As shown in Charts 19.1-19.8, peak usage period performance varied by service tier among participating ISPs during the September-October 2018 period. On average, during peak periods, the ratio of median download speed to advertised download speed for all ISPs was 57% or better, and 90% or better for most ISPs. However, the ratio of median download speed to advertised download speed varies among service tiers. It should be noted that for Verizon-DSL, which advertises a range of speeds, we have calculated a range of values corresponding to its advertised range. Out of the 44 speed tiers that were measured a large majority (41) showed that they at least achieved 90% of the advertised speed and 24 of the 44 tiers either met or exceeded the advertised speed.
Chart 19.1: The ratio of median download speed to advertised download speed, by ISP (0-5 Mbps).
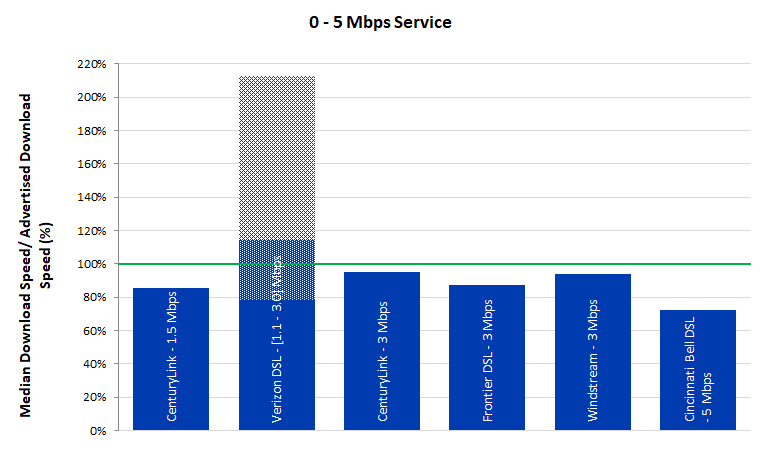
Chart 19.2: The ratio of median download speed to advertised download speed, by ISP (6-10 Mbps).

Chart 19.3: The ratio of median download speed to advertised download speed, by ISP (12-20 Mbps).
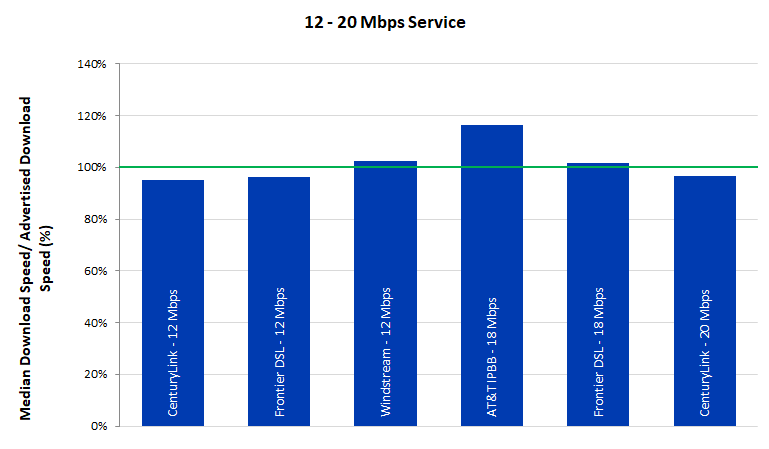
Chart 19.4: The ratio of median download speed to advertised download speed, by ISP (25-30 Mbps).
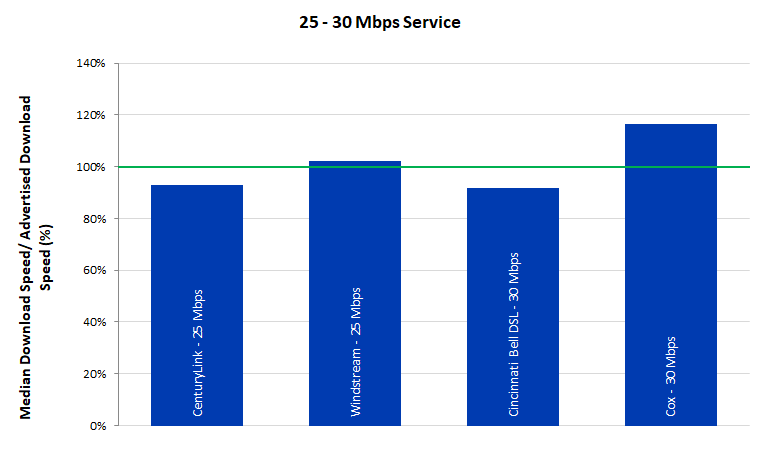
Chart 19.5: The ratio of median download speed to advertised download speed, by ISP (40-50 Mbps).
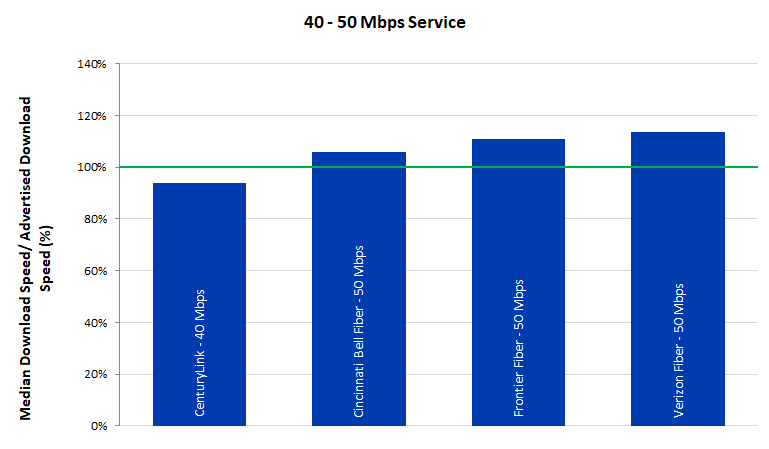
Chart 19.6: The ratio of median download speed to advertised download speed, by ISP (60-75 Mbps).
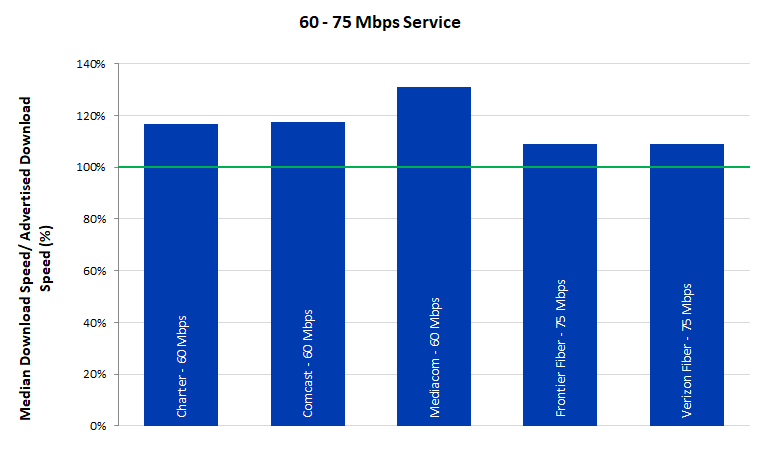
Chart 19.7: The ratio of median download speed to advertised download speed, by ISP (100-150 Mbps).
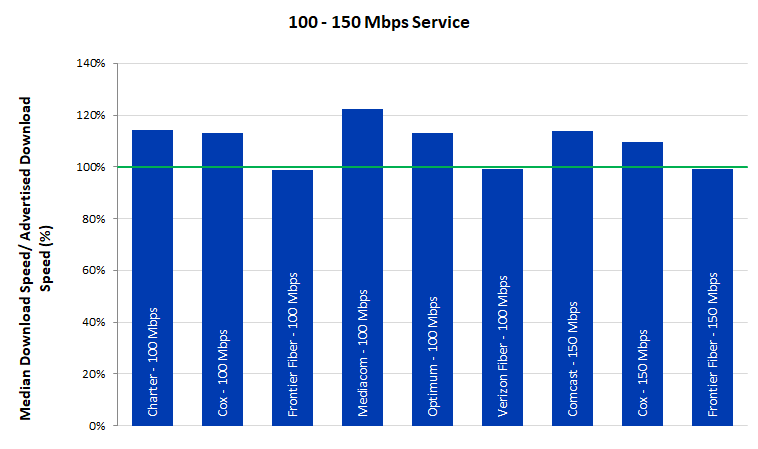
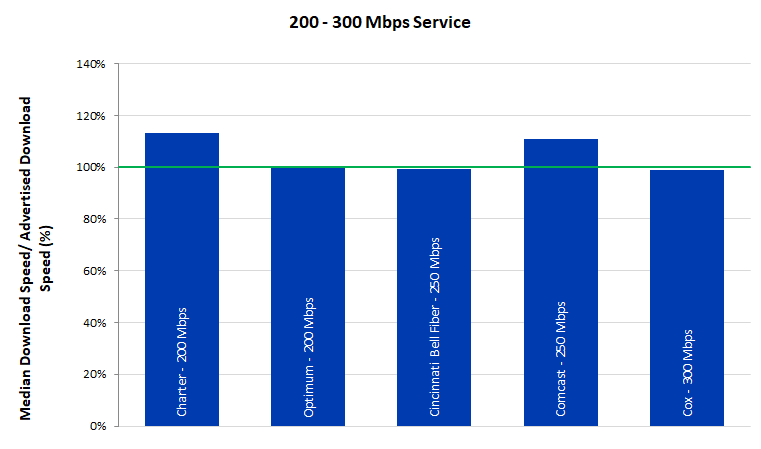
Chart 19.8: The ratio of median download speed to advertised download speed, by ISP (200-300 Mbps).
Charts 20.1 – 20.6 depict the ratio of median upload speeds to advertised upload speeds for each ISP by service tier.

Chart 20.2: The ratio of median upload speed to advertised upload speed, by ISP (0.896 – 1.5 Mbps).
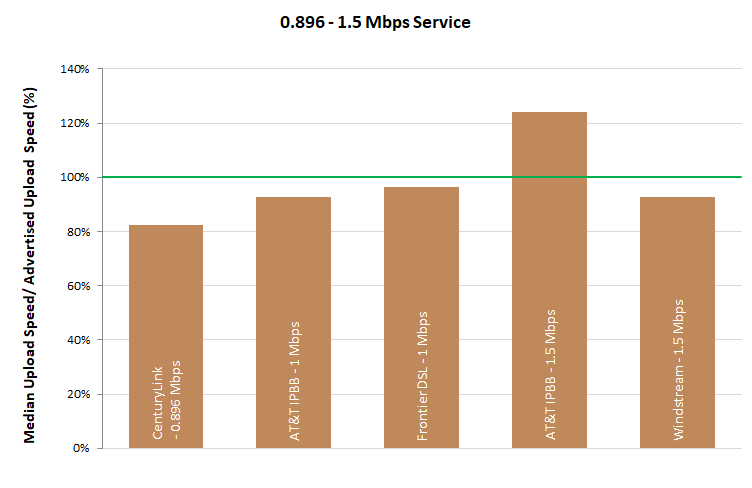
Chart 20.3: The ratio of median upload speed to advertised upload speed, by ISP (2-5 Mbps).

Chart 20.4: The ratio of median upload speed to advertised upload speed, by ISP (10 - 20 Mbps).
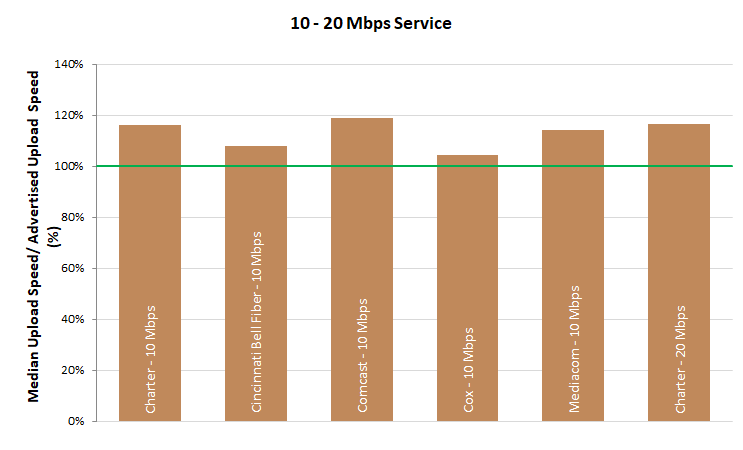
Chart 20.5: The ratio of median upload speed to advertised upload speed, by ISP (30 - 75 Mbps).
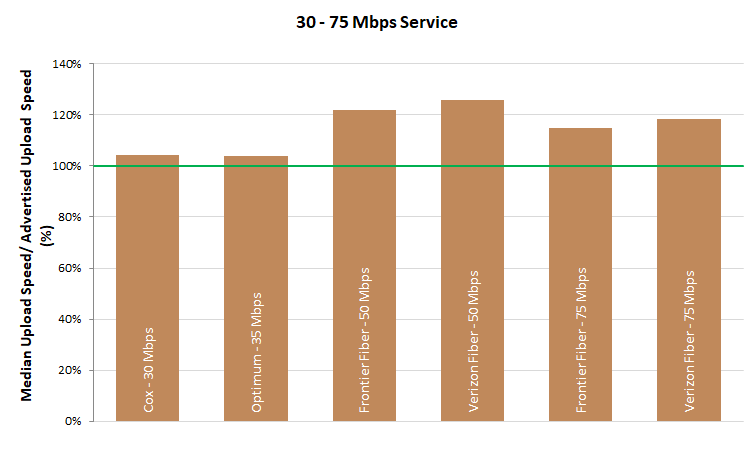
Chart 20.6: The ratio of median upload speed to advertised upload speed, by ISP (100-150 Mbps).
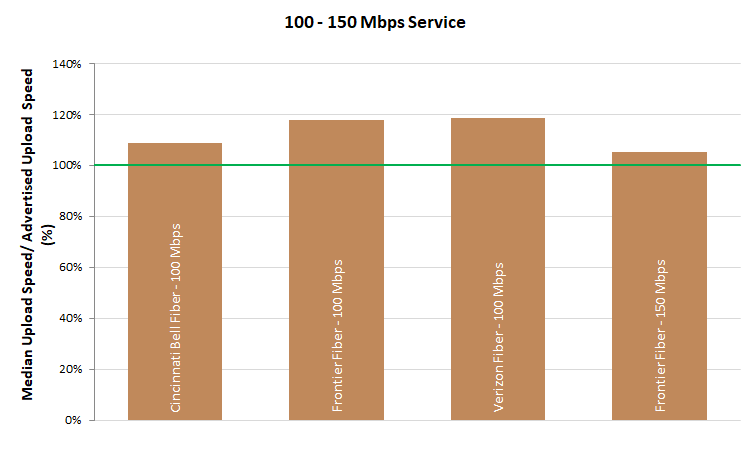
Table 2 lists the advertised download service tiers included in this study. For each tier, an ISP’s advertised download speed is compared with the median of the measured download speed results. As we noted in the past reports, the download speeds listed here are based on national averages and may not represent the performance experienced by any particular consumer at any given time or place.
Table 2: Peak period median download speed, sorted by actual download speed
|
Advertised Download Speed (Mbps) |
ISP |
Actual Speed / Advertised Speed (%) |
||
|
1.28 |
1.5 |
CenturyLink |
85.2 |
|
|
2.34 |
1.1 - 3 |
Verizon DSL |
114.2% (78.1% - 212.9%) |
|
|
2.86 |
3 |
CenturyLink |
95.2 |
|
|
2.61 |
3 |
Frontier DSL |
87 |
|
|
2.81 |
3 |
Windstream |
93.7 |
|
|
3.62 |
5 |
Cincinnati Bell DSL |
72.4 |
|
|
6.45 |
6 |
AT&T IPBB |
107.6 |
|
|
5.75 |
6 |
Frontier DSL |
95.9 |
|
|
6.86 |
7 |
CenturyLink |
98.0 |
|
|
9.35 |
10 |
CenturyLink |
93.6 |
|
|
10.08 |
10 |
Windstream |
100.8 |
|
|
11.42 |
12 |
CenturyLink |
95.1 |
|
|
11.53 |
12 |
Frontier DSL |
96.1 |
|
|
12.29 |
12 |
Windstream |
102.4 |
|
|
20.93 |
18 |
AT&T IPBB |
116.3 |
|
|
18.27 |
18 |
Frontier DSL |
101.5 |
|
|
19.35 |
20 |
CenturyLink |
96.8 |
|
|
23.28 |
25 |
CenturyLink |
93.1 |
|
|
25.55 |
25 |
Windstream |
102.2 |
|
|
27.54 |
30 |
Cincinnati Bell DSL |
91.8 |
|
|
34.90 |
30 |
Cox |
116.3 |
|
|
37.50 |
40 |
CenturyLink |
93.8 |
|
|
52.99 |
50 |
Cincinnati Bell Fiber |
106 |
|
|
55.45 |
50 |
Frontier Fiber |
110.9 |
|
|
56.75 |
50 |
Verizon Fiber |
113.5 |
|
|
69.90 |
60 |
Charter |
116.5 |
|
|
70.43 |
60 |
Comcast |
117.4 |
|
|
78.64 |
60 |
Mediacom |
131.1 |
|
|
81.82 |
75 |
Frontier Fiber |
109.1 |
|
|
81.73 |
75 |
Verizon Fiber |
109 |
|
|
114.26 |
100 |
Charter |
114.3 |
|
|
112.98 |
100 |
Cox |
113.0 |
|
|
98.82 |
100 |
Frontier Fiber |
98.8 |
|
|
122.35 |
100 |
Mediacom |
122.4 |
|
|
112.89 |
100 |
Optimum |
112.9 |
|
|
99.17 |
100 |
Verizon Fiber |
99.2 |
|
|
170.92 |
150 |
Comcast |
114.0 |
|
|
164.37 |
150 |
Cox |
109.6 |
|
|
148.61 |
150 |
Frontier Fiber |
99.1 |
|
|
226.53 |
200 |
Charter |
113.3 |
|
|
199.47 |
200 |
Optimum |
99.7 |
|
|
248.06 |
250 |
Cincinnati Bell Fiber |
99.2 |
|
|
277.39 |
250 |
Comcast |
111.0 |
|
|
296.67 |
300 |
Cox |
98.9 |
|
B. Variations In Speed
In Section 3.C above, we present speed consistency metrics for each ISP based on test results averaged across all service tiers. In this section, we provide detailed speed consistency results for each ISP’s individual service tiers. Consistency of speed is important for services such as video streaming. A significant reduction in speed for more than a few seconds can force a reduction in video resolution or an intermittent loss of service.
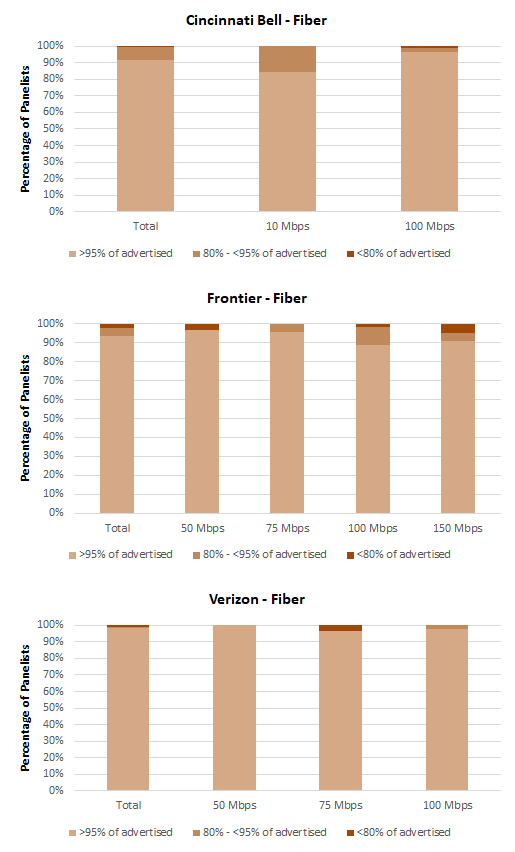
Charts 21.1 – 21.3 below show the percentage of consumers that achieved greater than 95%, between 85% and 95%, or less than 80% of the advertised download speed for each ISP speed tier. Consistent with past performance, ISPs using DSL technology frequently fail to deliver advertised service rates. ISPs quote a single ‘up-to’ speed, but the actual speed of DSL depends on the distance between the subscriber and the serving central office.
Cable companies and fiber-based systems, in general, showed a high consistency of speed.
Chart 21.1: The percentage of consumers whose median download speed was greater than 95%, between 80% and 95%, or less than 80% of the advertised download speed, by service tier (DSL).
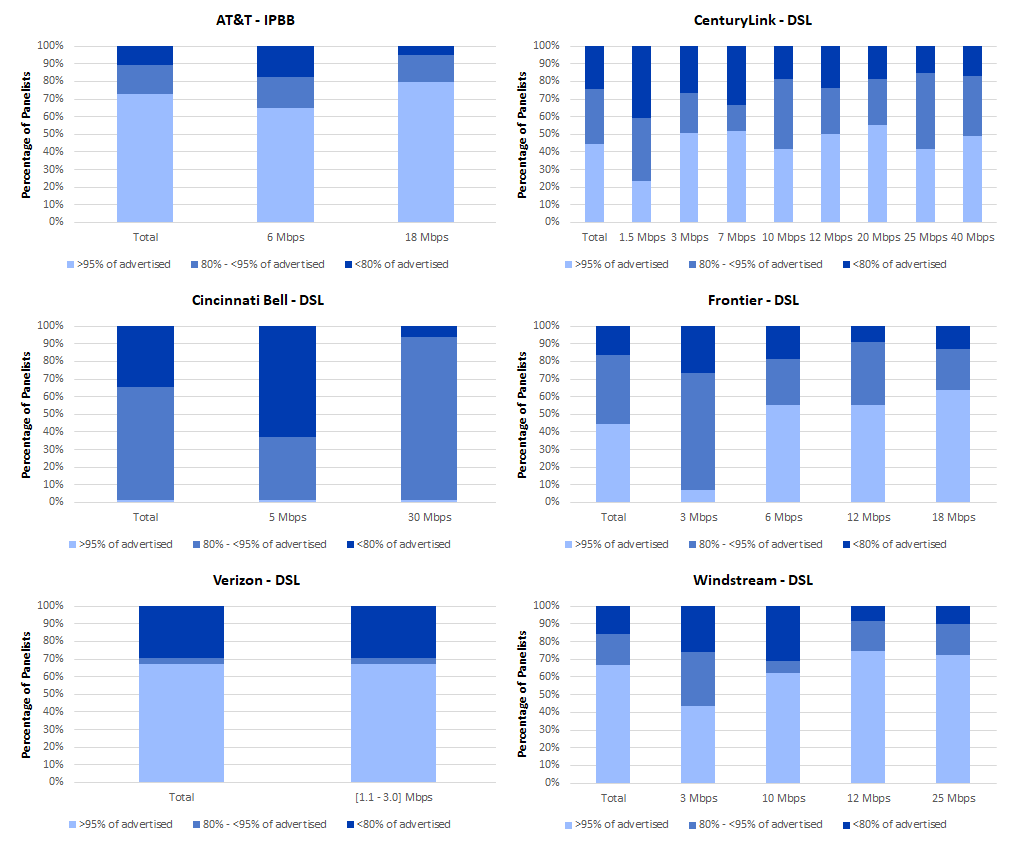

Similarly, Charts 22.1 to 22.3 show the percentage of consumers that achieved greater than 95%, between 85% and 95%, or less than 80% of the advertised upload speed for each ISP speed tier.
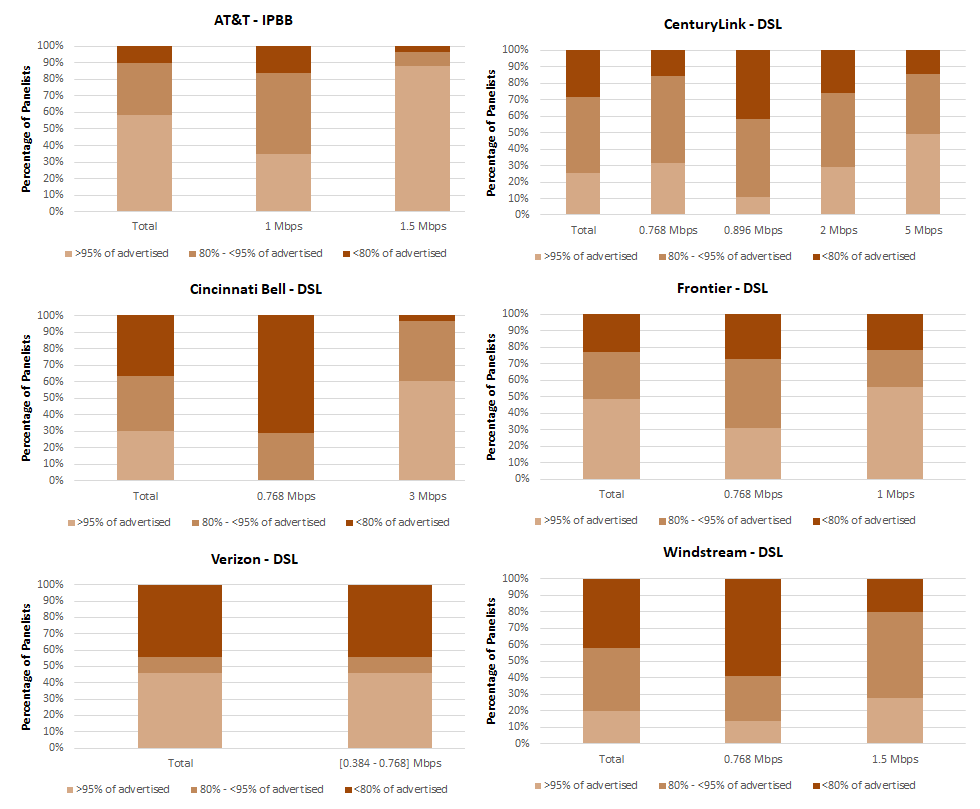
Chart 22.2: The percentage of consumers whose median upload speed was greater than 95%, between 80% and 95%, or less than 80% of the advertised upload speed (cable).
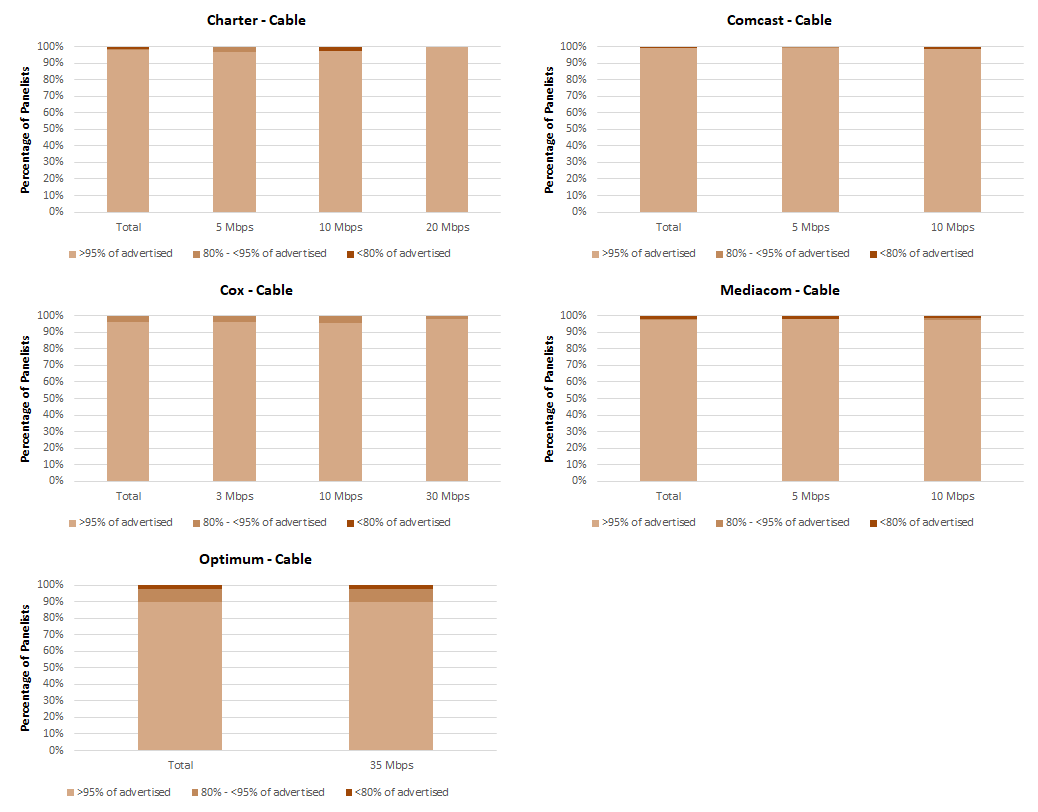
Chart 22.3: The percentage of consumers whose median upload speed was greater than 95%, between 80% and 95%, or less than 80% of the advertised upload speed (fiber and satellite).
In Section 3.C above, we present complementary cumulative distributions for each ISP based on test results across all service tiers. Below, we provide tables showing selected points on these distributions by each individual ISP. In general, DSL technology showed performance between 26% and 55% of advertised speed for at least 95% of their subscribers. Among cable-based companies, the average download speeds that at least 95% of their subscribers received were between 69% and 92% of advertised rates. Fiber-based services provided a range from 73% to 98% of advertised download speeds for at least 95% of subscribers.
Table 3: Complementary cumulative distribution of the ratio of median download speed to advertised download speed by ISP
|
ISP |
20% |
50% |
70% |
80% |
90% |
95% |
|
AT&T IPBB |
123.0% |
109.6% |
97.1% |
88.4% |
79.2% |
69.8% |
|
CenturyLink |
103.7% |
93.1% |
83.7% |
76.5% |
67.8% |
55.0% |
|
Cincinnati Bell Fiber |
107.5% |
102.5% |
94.7% |
92.5% |
82.6% |
72.8% |
|
Cincinnati Bell DSL |
92.1% |
85.8% |
77.2% |
63.1% |
40.2% |
26.0% |
|
Charter |
116.7% |
114.6% |
111.8% |
106.2% |
98.8% |
92.1% |
|
Comcast |
118.1% |
114.9% |
110.9% |
107.5% |
95.4% |
82.2% |
|
Cox |
117.0% |
111.5% |
104.6% |
99.6% |
91.3% |
81.8% |
|
Frontier Fiber |
110.7% |
99.8% |
97.4% |
95.2% |
90.7% |
86.8% |
|
Frontier DSL |
107.5% |
93.0% |
86.5% |
81.4% |
66.7% |
46.0% |
|
Mediacom |
132.4% |
127.2% |
118.2% |
112.2% |
86.6% |
79.7% |
|
Optimum |
113.1% |
104.0% |
98.8% |
94.8% |
85.9% |
69.0% |
|
Verizon Fiber |
113.5% |
109.1% |
104.2% |
100.0% |
98.9% |
98.1% |
|
Verizon DSL |
131.2% |
114.2% |
85.7% |
61.4% |
55.8% |
49.3% |
|
Windstream |
106.1% |
100.1% |
93.7% |
87.4% |
55.6% |
48.6% |
Table 4: Complementary cumulative distribution of the ratio of median upload speed to advertised upload speed by ISP
|
ISP |
20% |
50% |
70% |
80% |
90% |
95% |
|
AT&T IPBB |
137.3% |
120.8% |
91.7% |
88.7% |
78.3% |
59.5% |
|
CenturyLink |
96.8% |
86.8% |
80.8% |
74.3% |
62.1% |
50.7% |
|
Cincinnati Bell Fiber |
109.1% |
108.7% |
107.7% |
105.7% |
95.0% |
94.7% |
|
Cincinnati Bell DSL |
95.5% |
86.9% |
77.7% |
75.7% |
73.2% |
57.4% |
|
Charter |
117.0% |
116.4% |
114.7% |
113.5% |
111.4% |
107.6% |
|
Comcast |
119.0% |
118.6% |
118.2% |
117.7% |
116.3% |
113.9% |
|
Cox |
104.7% |
104.2% |
103.6% |
102.5% |
100.6% |
96.1% |
|
Frontier Fiber |
121.8% |
114.8% |
103.0% |
100.9% |
99.6% |
92.6% |
|
Frontier DSL |
147.7% |
94.8% |
84.6% |
76.4% |
63.1% |
48.9% |
|
Mediacom |
116.8% |
114.3% |
114.1% |
113.7% |
112.3% |
108.0% |
|
Optimum |
105.3% |
103.9% |
102.5% |
100.7% |
96.0% |
88.4% |
|
Verizon Fiber |
126.1% |
121.0% |
118.5% |
118.1% |
114.5% |
111.5% |
|
Verizon DSL |
118.9% |
90.8% |
73.8% |
63.7% |
59.7% |
56.7% |
|
Windstream |
94.9% |
83.6% |
73.7% |
70.9% |
49.2% |
28.3% |
E. Web Browsing Performance, By Service Tier
Below, we provide the detailed results of the webpage download time for each individual service tier of each ISP. Generally, website loading time decreased steadily with increasing tier speed until a tier speed of 15 Mbps and does not change markedly above that speed.
Chart 23.1: Average webpage download time, by ISP (1.1-5 Mbps).

Chart 23.2: Average webpage download time, by ISP (6-10 Mbps),
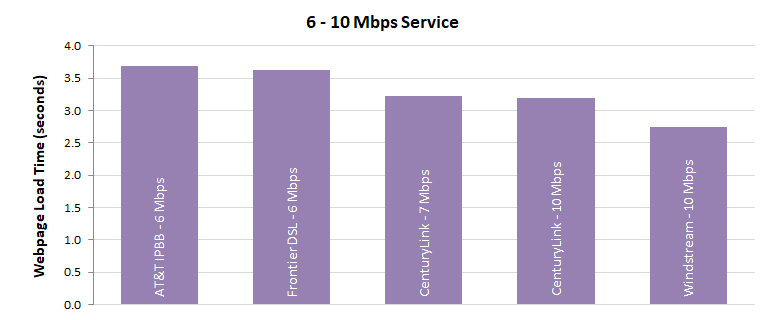
Chart 23.3: Average webpage download time, by ISP (12-20 Mbps).
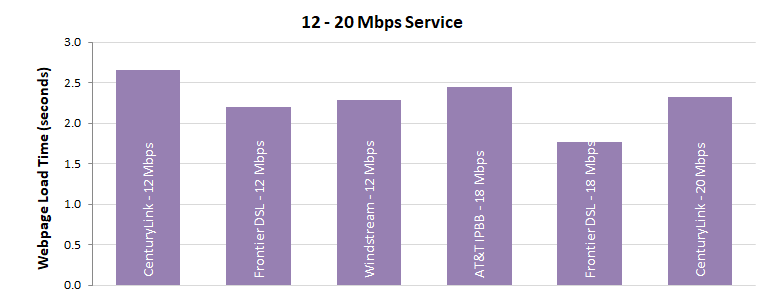
Chart 23.4: Average webpage download time, by ISP (25-30 Mbps).
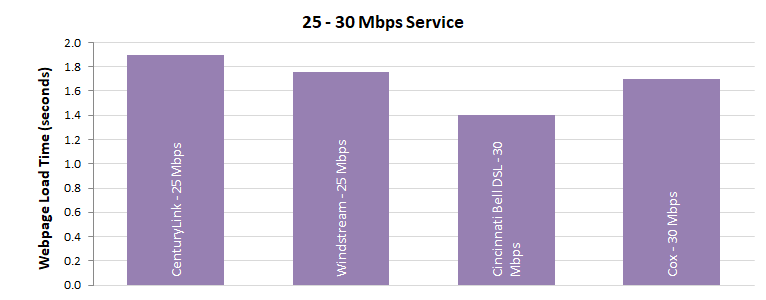
Chart 23.5: Average webpage download time, by ISP (40-50 Mbps).
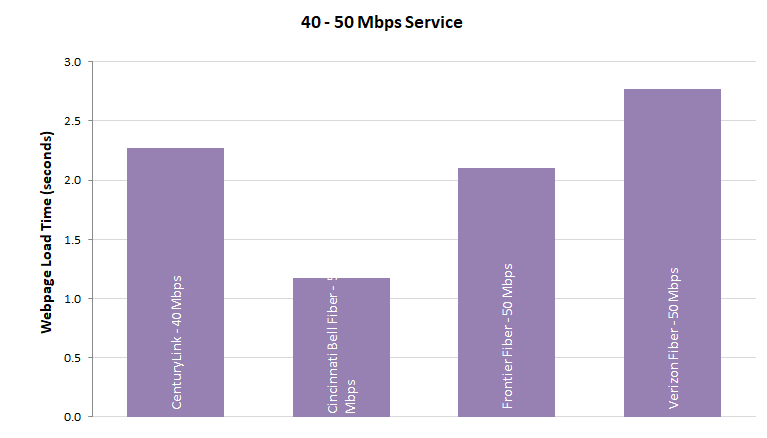
Chart 23.6: Average webpage download time, by ISP (60-75 Mbps).
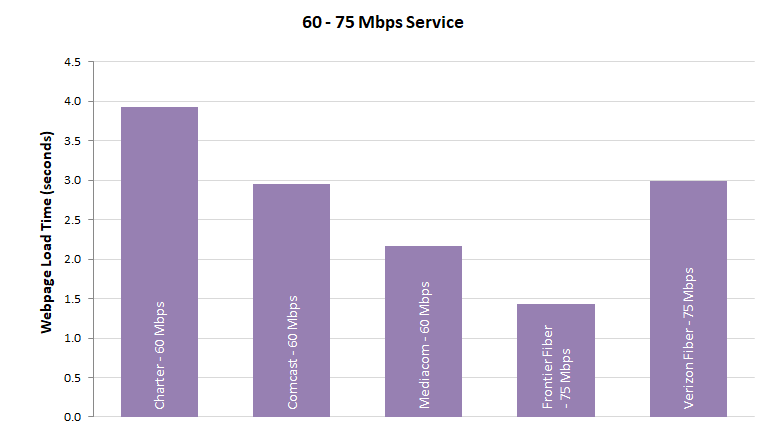
Chart 23.7: Average webpage download time, by ISP (100-150 Mbps).
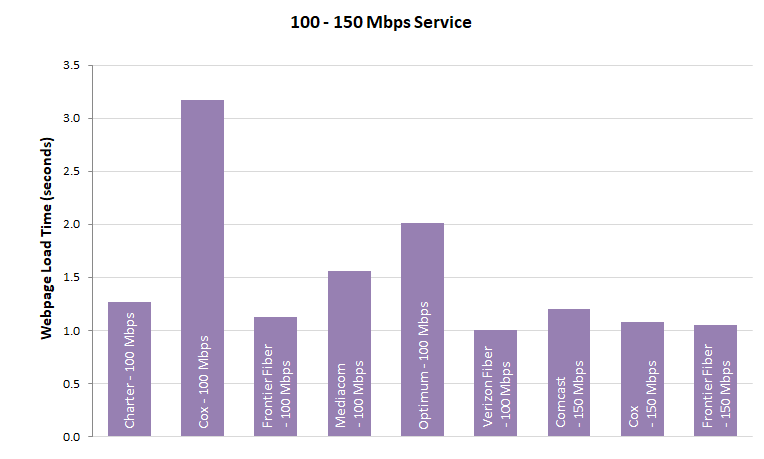
Chart 23.8: Average webpage download time, by ISP (200-300 Mbps).
[1] The actual dates used for measurements for this Ninth Report were September 25 – October 25, 2018 (inclusive).
[2] At the request of and with the assistance of the State of Hawaii Department of Commerce and Consumer Affairs (DCCA) the state of Hawaii was added to the MBA program in 2017. The ISPs whose performance were measured in the State of Hawaii were Hawaiian Telcom and Oceanic Time Warner Cable (which is now a part of Charter Spectrum).
[3] All reports can be found at https://www.fcc.gov/general/measuring-broadband-america.
[4] The First Report (2011) was based on measurements taken in March 2011, the Second Report (2012) on measurements taken in April 2012, and the Third (2013) through Eighth (2018) Reports on measurements taken in September of the year prior to the reports’ release dates. In order to avoid confusion between the date of release of the report and the measurement dates we have shifted last year to numbering the reports. Thus, this year’s report is termed the Ninth MBA Report instead of the 2019 MBA Report. Going forward we will continue with a numbered approach and the next report will be termed as the Tenth Report.
[5] We first determine the mean value over all the measurements for each individual panelist’s “whitebox.” (Panelists are sent “whiteboxes” that run pre-installed software on off-the-shelf routers that measure thirteen broadband performance metrics, including download speed, upload speed, and latency.) Then for each ISP’s speed tiers, we choose the median of the set of mean values for all the panelists/whiteboxes. The median is that value separating the top half of values in a sample set with the lower half of values in that set; it can be thought of as the middle (i.e., most typical) value in an ordered list of values. For calculations involving multiple speed tiers, we compute the weighted average of the medians for each tier. The weightings are based on the relative subscriber numbers for the individual tiers.
[6] Only tiers that contribute to the top 80% of an ISPs total subscribership are included in this report.
[7]The ISPs that provided SamKnows, the FCC’s contractor supporting the MBA program, with weights for each of their tiers were: Cincinnati Bell, CenturyLink, Charter, Comcast, Cox Frontier, Hawaiian Telcom, Optimum, and Verizon.
[8] For an explanation of Form 477 filing requirements and required data see: https://transition.fcc.gov/form477/477inst.pdf (Last accessed 5/2/2018).
[9] The sum of all forms of IP video, which includes Internet video, IP video-on-demand (VoD), video files exchanged through file sharing, video-streamed gaming, and video conferencing, will continue to be in the range of 80 to 90 percent of total IP traffic. Globally, IP video traffic will account for 82 percent of traffic by 2022. See Cisco Visual Networking Index: Forecast and Methodology, 2017-2022 White Paper, https://www.cisco.com/c/en/us/solutions/collateral/service-provider/visual-networking-index-vni/white-paper-c11-741490.html (Last accessed Dec. 12, 2019).
[10] Although AT&T IPBB has been characterized here as a DSL technology it actually includes a mix of ADSL2+, VDSL2, G.Fast and Ethernet technologies delivered over a hybrid of fiber optic and copper facilities.
[11] Where several technologies are plotted at the same point in the chart, this is identified as “Multiple Technologies.”
[12] Of the 4,545 panelists who participated in the September 2017 collection of data, 4,355 panelists continued to participate in the September-October 2018 collection of data.
[13] We do not attempt here to distinguish between these two cases.
[14] For a detailed definition and discussion of this metric, please refer to the Technical Appendix.
[15] See: https://www.voip-info.org/wiki/view/QoS and http://www.ciscopress.com/articles/article.asp?p=357102.
[17]Both AT&T and Hughes Network Systems left the program as participating ISPs this year, bringing the total number of participating ISPs to eleven. We continued to evaluate AT&T’s sets of tiers with sufficient numbers of panelists despite the fact that AT&T did not participate this year, so the total number of ISPs evaluated in this report was twelve. As of the Eighth Report (previous year’s report), Viasat, operating under the brand name Exede internet, left the program as a participating ISP the prior year and consequently no longer provides panelists with an increased data allowance to offset the data used by the MBA measurements. We, however, continue reporting raw data results for ViaSat/Exede and Hughes Network Systems tiers by using lightweight tests aimed at reducing the data burden on these panelists. These tests are described in greater detail in the accompanying Technical Appendix to this Ninth MBA Report.
[18] This proposed time period avoids the dates in early September when parts of North Carolina and Florida were affected by Hurricanes Florence and Michael. It also avoided the increased traffic resulting from latest iOS release which also took place in early September. Omitting dates during these periods was done consistent with the FCC’s data collection policy for fixed MBA data. See FCC, Measuring Fixed Broadband, Data Collection Policy, https://www.fcc.gov/general/measuring-broadband-america-measuring-fixed-broadband (explaining that the FCC has developed policies to deal with impairments in the data collection process with potential impact for the validity of the data collected).
[19]The MBA program uses test servers that are both neutral (i.e., operated by third parties that are not ISP-operated or owned) and located as close as practical, in terms of network topology, to the boundaries of the ISP networks under study. As described earlier in this section, a maximum of two interconnection points and one transit network may be on the test path. If there is congestion on such paths to the test server, it may impact the measurement, but the cases where it does so are detectable by the test approach followed by the MBA program, which uses consistent longitudinal measurements and comparisons with averaged results. Details of the methodology used in the MBA program are given in the Technical Appendix to this report.
[20] Independent research, drawing on the FCC’s MBA test platform [numerous instances of research supported by the fixed MBA test platform are described at https://www.fcc.gov/general/mba-assisted-research-studies, suggests that home networks are a significant source of end-to-end service congestion. See Srikanth Sundaresan et al., Home Network or Access Link? Locating Last-Mile Downstream Throughput Bottlenecks, PAM 2016 - Passive and Active Measurement Conference, at 111-123, March 2016.
[21] The September-October 2018 data set was validated to remove anomalies that would have produced errors in the Report. This data validation process is described in the Technical Appendix.
[22] The software that was used for the MBA program will be made available for noncommercial purposes. To apply for noncommercial review of the code, interested parties may contact SamKnows directly at team@samknows.com, with the subject heading “Academic Code Review.”
[23] Measured service tiers were tiers which constituted the top 80% of an ISP’s broadband subscriber base.
[24] In these charts, we show Verizon’s median speed as a percentage of the mid-point between their lower and upper advertised speed range.
[25] In Reports prior to the 2015 MBA Report, for each ratio of actual to advertised download speed on the horizontal axis, the cumulative distribution function curves showed the percentage of measurements, rather than panelists subscribing to each ISP, that experienced at least this ratio. The methodology used since then, i.e., using panelists subscribing to each ISP, more accurately illustrates ISP performance from a consumer’s point of view.
[26] The speed achievable by DSL depends on the distance between the subscriber and the central office. Thus, the complementary cumulative distribution function will fall slowly unless the broadband ISP adjusts its advertised rate based on the subscriber’s location. (Chart 16 illustrates that the performance during non-busy hours is similar to the busy hour, making congestion less likely as an explanation.)
[27] As described earlier, Verizon DSL download and upload results are shown as a range since Verizon advertises its DSL speed as a range rather than as a specific speed.
[28] In this chart, we have shown the median download speed of Verizon-DSL as a percentage of the midpoint of the advertised speed range for its tier.